Alerts
Alerts are created by the Operations Center when an event matches a rule and a threat is detected.
Concepts
Alert Status and Lifecycle
Sekoia.io allows you to customize alert statuses to adapt them to your SOC team's specific processes. Custom statuses enable you to define workflows that match your organization's requirements while maintaining consistency across alerts and cases.
Automatic Migration
Legacy alert statuses (Pending, Acknowledged, Ongoing, Closed, Rejected) are automatically converted to custom statuses for existing users. Your current workflows remain unchanged.
Default Alert Statuses
By default, alerts use the following five statuses:
| Status | Description | Possible actions to do |
|---|---|---|
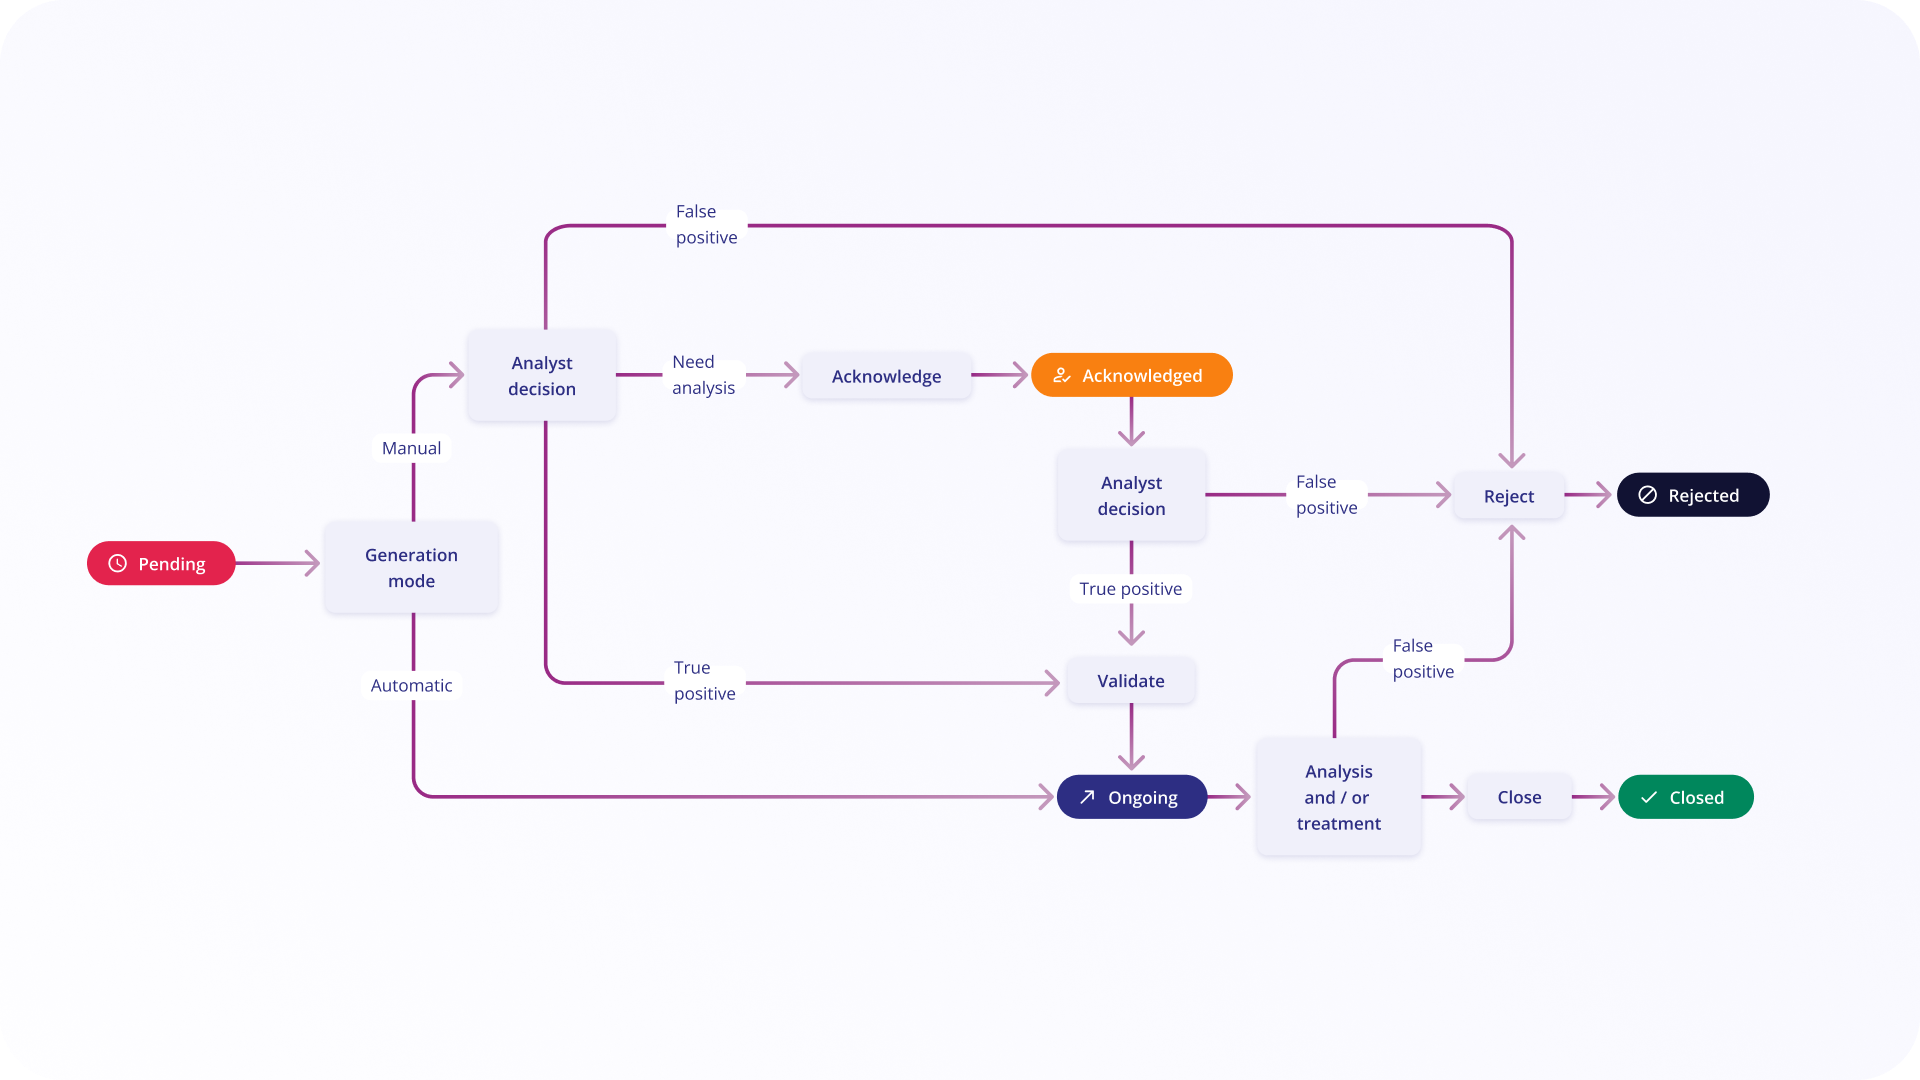
| Pending | As soon as an alert is triggered, it is placed in 'Pending' status. If the generation mode for this alert is 'Automatic', this status changes automatically to 'Ongoing'. | Acknowledge, Reject, Validate |
| Acknowledged | This status is used when an analysis is ongoing. If the analyst can decide if an alert is a true or a false positive quickly, this status can be optional, time to acknowledge used in statistics will be set to time to change to Ongoing or Rejected status. | Validate, Reject |
| Ongoing | Alert is considered as true positive and countermeasures have not yet been applied. This status is the first one seen in case of automatic mode. | Close (countermeasures have been applied, no more alert), Reject (after more analysis, this alert was a false positive) |
| Closed | All necessary actions have been applied to the alert. This status is a final status. | No action accepted |
| Rejected | The alert was a false positive. This status is a final status. | No action accepted |
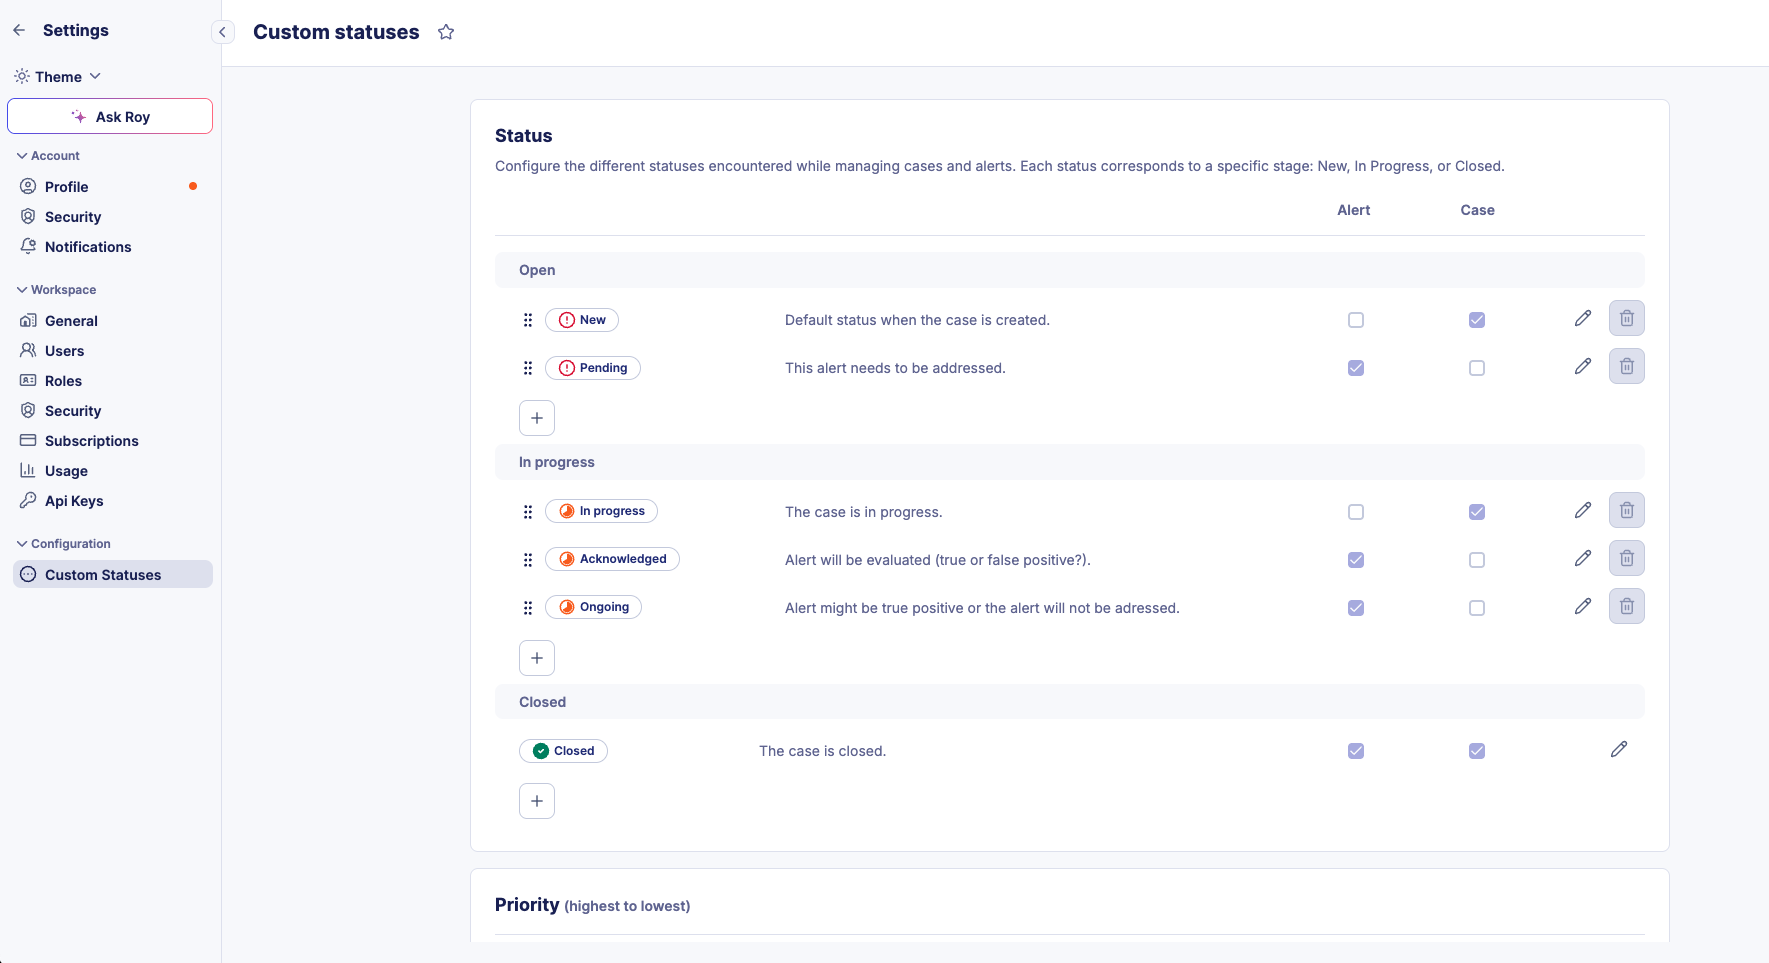
Managing Custom Statuses
Custom statuses allow you to tailor the alert lifecycle to your SOC team's specific processes. You can create, edit, and organize statuses to match your organization's workflow requirements.
Status Stages
Each custom status belongs to one of three stages that define its position in the alert lifecycle:
- Open: Initial stage for new or unprocessed alerts
- In Progress: Intermediate stage for alerts under investigation or awaiting action
- Closed: Final stage for alerts that have been resolved or dismissed
These stages determine the overall state of an alert and affect features such as search filters and similarity.
Creating and Editing Custom Statuses
To manage custom statuses for alerts:
- Navigate to the Custom Statuses configuration page
- Click on
+to create a new custom status in the appropriate stage - Provide the following information:
- Name: A clear, descriptive name for the status (e.g., "Under Investigation", "Awaiting User Response")
- Description: Additional context about when this status should be used
To edit an existing custom status:
- Click on the status you want to modify
- Update the name and/or description as needed
- Save your changes
Note
Modifying a custom status name or description does not affect historical data. Previously recorded status changes will continue to display the original values in alert timelines and case histories.
Reordering Statuses
You can reorder custom statuses to match your preferred workflow sequence:
- In the Custom Statuses configuration page, use the drag handle on each status
- Drag and drop statuses to your desired order
- The new order will be reflected in status dropdowns throughout the platform
Enabling Statuses for Alerts and Cases
A unique feature of custom statuses is the ability to use the same status across both alerts and cases, ensuring consistency across your SOC platform.
To enable a status for alerts and/or cases:
- In the Custom Statuses configuration, locate the status you want to configure
- Use the checkboxes in the Alert and Case columns to enable the status for each context
- A status can be enabled for:
- Alerts only
- Cases only
- Both alerts and cases (unified status)
This unified approach allows you to maintain consistent terminology and processes across different investigation contexts.
Deleting Custom Statuses
Custom statuses can be deleted only if they are not currently in use:
- If a status has been applied to any alert or case, it cannot be deleted
- To delete a status that is in use, you must first change all alerts and cases using that status to a different status
- Once no alerts or cases use the status, you can delete it from the configuration page
Warning
Before deleting a custom status, ensure that your team no longer needs it, as this action will remove it from all status selection menus.
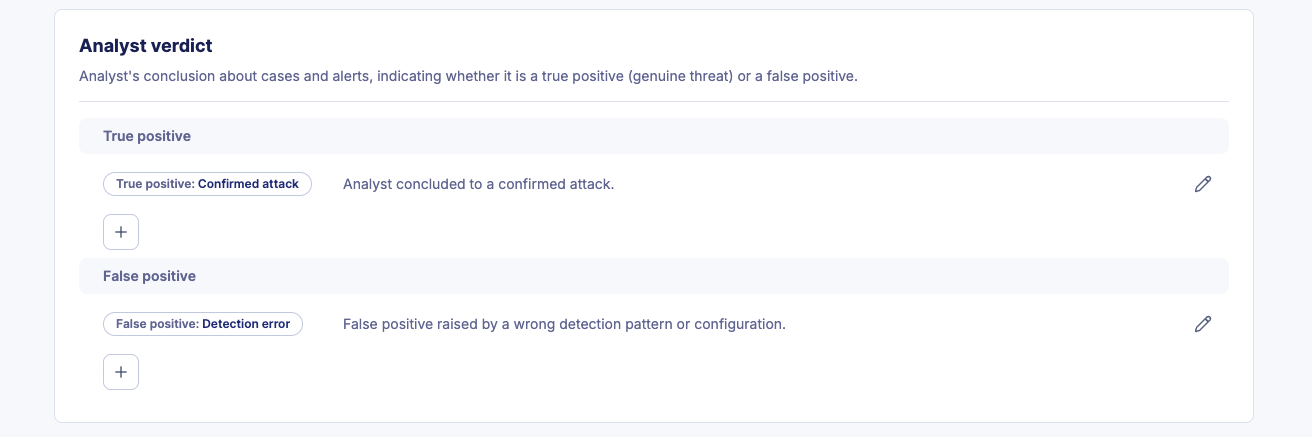
Custom Verdicts
Custom verdicts enable SOC teams to define and standardize their classifications of alerts and cases beyond simple true positive or false positive determinations. This feature helps clarify your team's stance on incident outcomes and improves communication within the team and with stakeholders.
Verdict Categories
Each custom verdict belongs to one of two categories:
- True Positive: Verdicts that confirm the alert represents a genuine security threat or incident
- False Positive: Verdicts that indicate the alert was triggered incorrectly or does not represent a real threat
SOC teams often have different definitions and nuances for what constitutes a true or false positive. Custom verdicts allow you to capture these distinctions (e.g., "True Positive - Confirmed Malware", "False Positive - Misconfiguration", "True Positive - Policy Violation").
Creating and Editing Custom Verdicts
To manage custom verdicts for alerts and cases:
- Navigate to the Analyst verdict section
- Click on
+to create a new custom verdict in the appropriate category - Provide the following information:
- Name: A clear, descriptive name for the verdict (e.g., "Confirmed Malware", "Benign Activity", "Policy Violation")
- Description: Additional context about when this verdict should be used and what it signifies
To edit an existing custom verdict:
- Click on the verdict you want to modify
- Update the name and/or description as needed
- Save your changes
Deleting Custom Verdicts
Custom verdicts follow the same deletion rules as custom statuses:
- A verdict cannot be deleted if it has been applied to any alert or case
- To delete a verdict that is in use, you must first remove or change the verdict on all alerts and cases using it
- Once the verdict is no longer in use, you can delete it from the configuration page
Tip
Custom verdicts help avoid miscommunication by establishing clear, documented definitions for alert and case outcomes. This is particularly valuable when multiple analysts work on the same alerts or when reporting to stakeholders.
Alerts Workflow (Legacy)
The workflow diagram below illustrates the legacy alert status lifecycle:
Alert Urgency
The Urgency is a number used to give a score to the risk associated with a specific alert. It is calculated from the severity of a rule and the criticality of assets related to the alert. This gives a value between 1 (very low risk) and 100 (very high risk).
The urgency of an alert is calculated using the following formula:
Alert urgency = (Severity of the rule + Criticality of the asset) / 2
Note
When the criticality of an asset is equal to 0 (N/A), the alert urgency is equal to the severity of the rule.
The urgency can have two different representations on the interface: a numerical and a textual representation.
| Display | Value |
|---|---|
| Low | [0-50[ |
| Medium | [50-75[ |
| High | [75-100] |
Alert Similarity
Alert similarity (Occurrence) is the process by which we collect similar events in the same alert.
The information is available in the Alerts table → Column Occurrence.
Example
If an alert has 24 occurrences, it means that it contains 24 events that were classified as similar and put in the same alert.
Similarity strategies
Alerts are considered similar if a list of fields defined by the similarity strategy have the same values for all events. Some fields may also be grouped together to specify that their values may be swapped.
Note
The effective similarity strategy for an alert is displayed in the alert details tab.
There are three possibilities to define the similarity strategy to use. By order:
Similarity by rule
Rules written by Sekoia.io and available in the Rules Catalog may define specific similarity strategies.
Similarity strategies by rule can be defined during the rule creation process. Learn more about how to do it in this section.
Similarity by event
Depending on the events that triggered an alert, Sekoia.io applies a similarity logic. This logic follows Sekoia.io guidelines and cannot be edited by users directly.
If the event matches one of the conditions listed below, the associated similarity strategy is used.
| Conditions | Similarity Strategy |
|---|---|
If dns.question.name exists |
[sekoiaio.entity.uuid, [source.ip, destination.ip], dns.question.name] |
If event.dialect is Windows and user.name exists |
[sekoiaio.entity.uuid, user.name, user.id] |
If event.dialect is Azure Windows and process.name exists |
[sekoiaio.entity.uuid, process.name, process.command_line] |
If event.dialect is Azure Active Directory and user.name exists and action.name exists |
[sekoiaio.entity.uuid, user.name, user.id, action.name, action.type, action.outcome] |
If event.dialect is Azure Active Directory and action.name exists |
[sekoiaio.entity.uuid, action.name, action.type, action.outcome] |
If event.dialect is postfix |
[sekoiaio.entity.uuid, email.from.address] |
If file.hash.sha256matches the rule |
[sekoiaio.entity.uuid, file.hash.sha256] |
If file.hash.sha1 matches the rule |
[sekoiaio.entity.uuid, file.hash.sha1] |
If file.hash.md5matches the rule |
[sekoiaio.entity.uuid, file.hash.md5] |
Note
In case similarity forced by your events does not answer your needs, feel free to contact your support.
Default similarity
If there is no similarity forced by the rule or by the event, you can rely on Sekoia.io default similarity formula: same entity, same source.ip and destination.ip.
source.ip and destination.ip can be used interchangeably.
Important
When there is no data due to parsing issues, alert similarity is not shown except when there is a NULL propriety in source.ip or destination.ip. When the source.ip and the destination.ip are empty, we might use the value NULL as a similarity basis.
Similarity and alert status
As long as there is an existing similar alert with a status in the Open or In Progress stage (such as Pending, Acknowledged, or Ongoing in the default configuration), new matches are added to the alert as occurrences.
If only alerts with statuses in the Closed stage (such as Closed or Rejected in the default configuration) are similar, a new alert is created. Similar alerts with closed-stage statuses are listed inside the Similar Alerts tab.
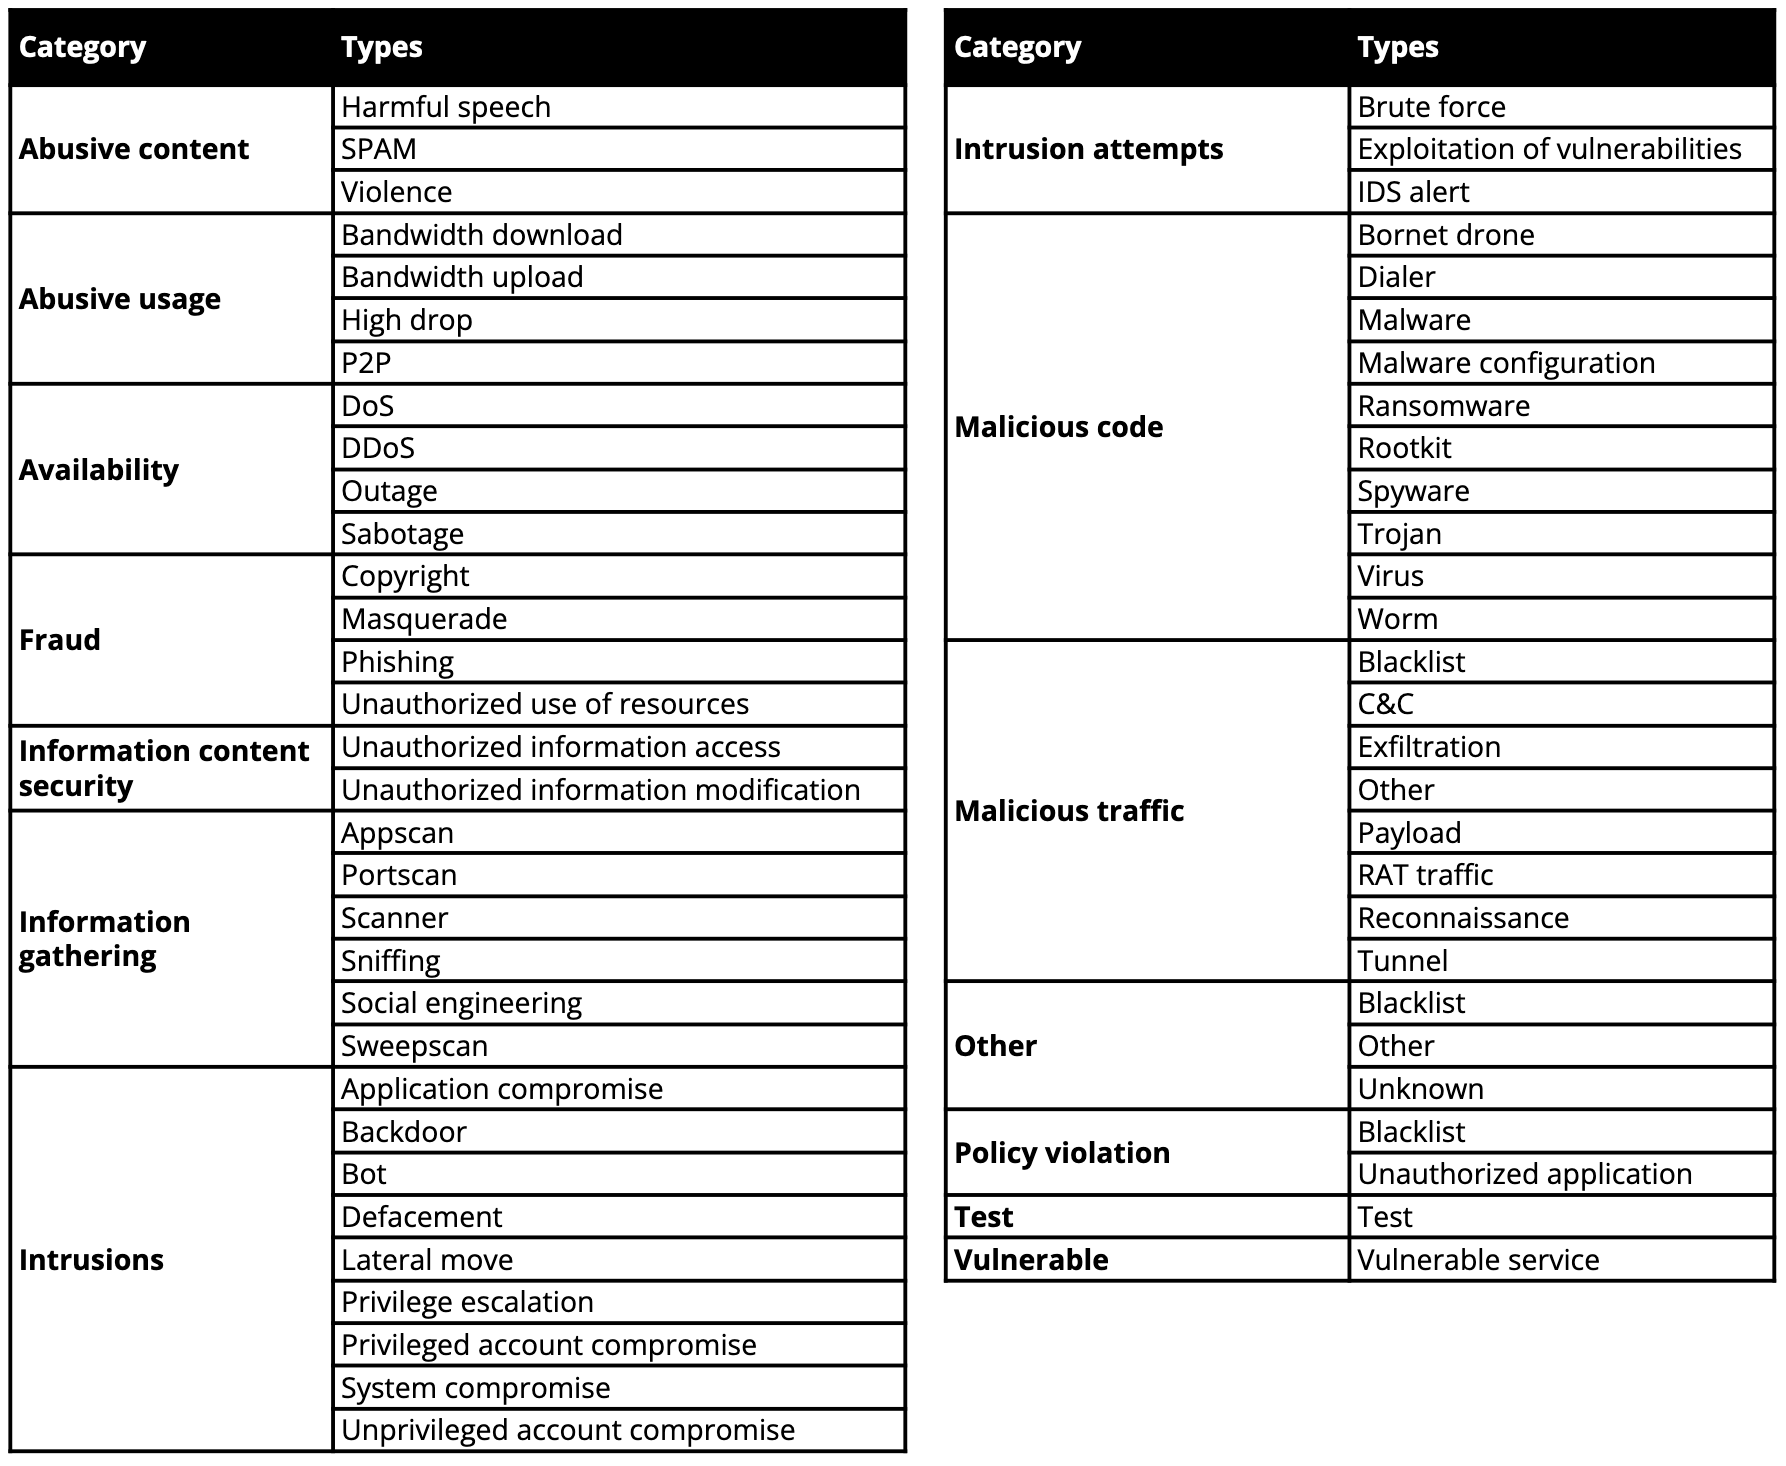
Alert types and categories
The Alert type is associated with the rule that triggered it but can be changed with the value associated to specific indicators in case of CTI rules.
The Alert type is defined according to a custom set of values derived from the Reference Incident Classification Taxonomy of ENISA.
Alerts listing
When you first connect to Sekoia.io, the alerts page will display the last 10 alerts raised on your community ordered by Most Recent ones.
Main features
From the left to the right, several features are available on the top screen:
- A
refreshbutton in the breadcrumb next to the page titleAlertsto show the newly generated alerts - A
Filtersbutton to filter your alerts' table (more details here) - A
show/hidecolumns button that lets you display fields you’re interested in. You can select or deselect columns but also drag and drop them depending on the order you need - Filters that let you display alerts by order of
Most Frequent,Recently Updated,Recently CreatedorMost Urgent
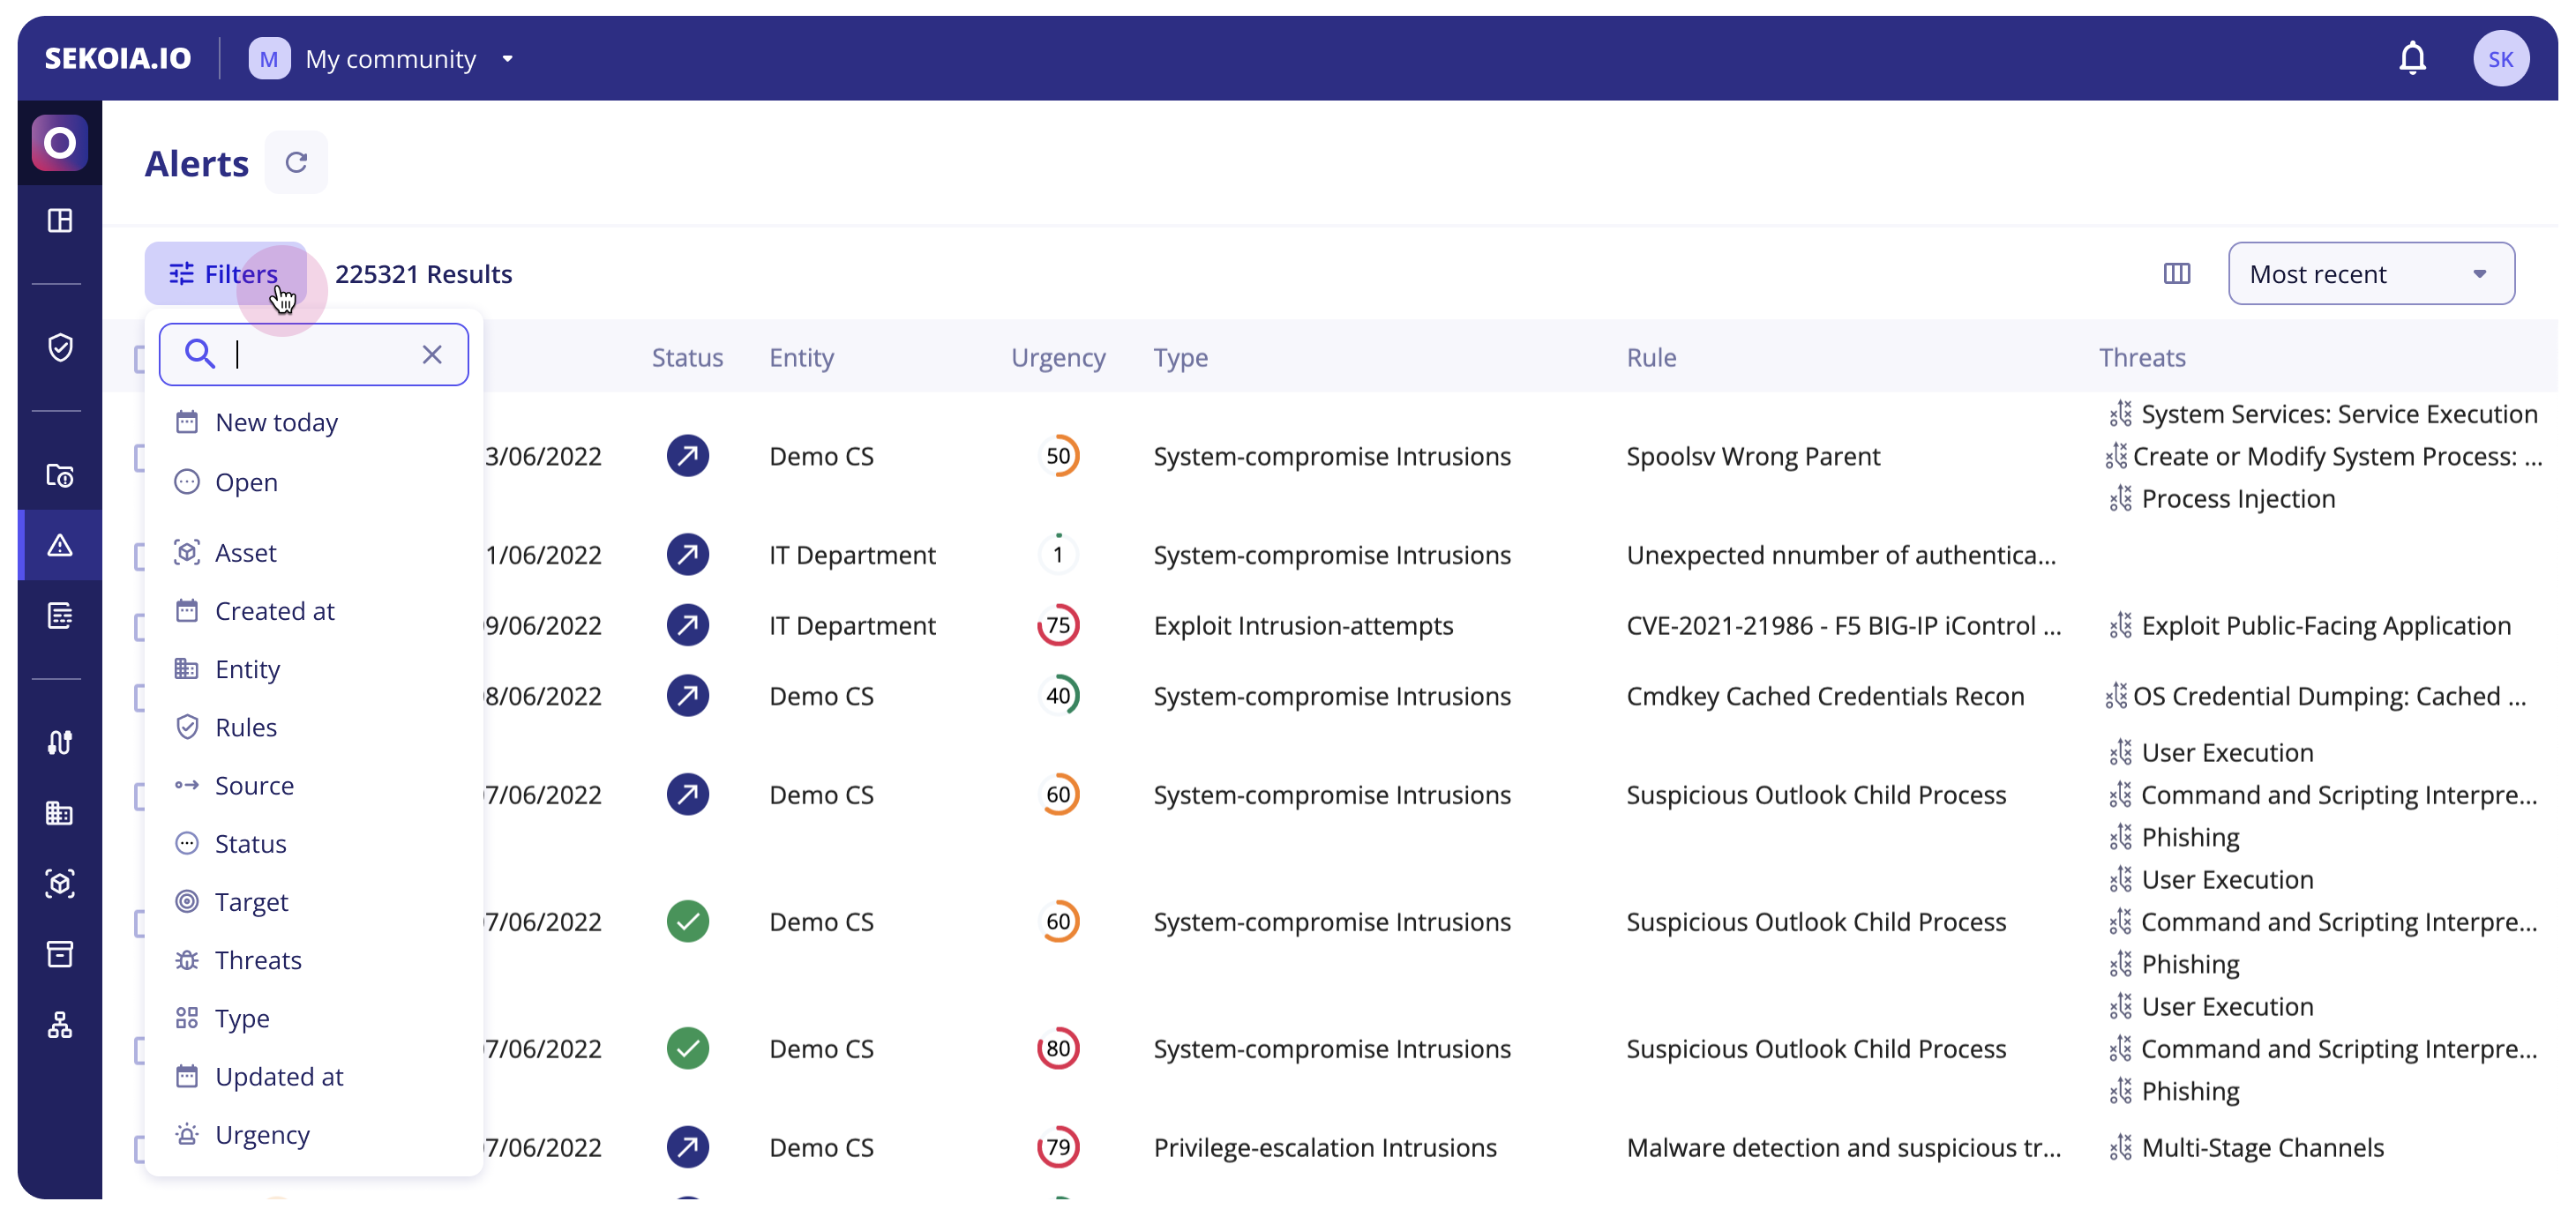
Filters
The new filter feature will give analysts the ability to construct complex queries and exclude specific values, providing them with greater control and allowing them to make more informed decisions based on a richer set of data.
Apply filters
To use complex filters, just click on the Filter button or hit your f key on your keyboard.
The menu is now opened and you can directly search for the filter you want to apply. Right after you choose your filter, you are invited to search and select one or multiple values for this filter.
You can change the operator (filer is value, filter is not value, filter is any of values) to have more advanced exclusion capacities.
Tip
You can combine filters and add as many filters as you want. The default operator between filters is AND.
Note
To edit filters (values, operator), just click on the value or the operator and select what you need. These new filters will be applied automatically.
Keyboard navigation
To improve navigation and accessibility, you can now navigate within the filter component just by using your keyboard.
Here is a list of keyboard shortcuts that can be useful to you:
| Key | Action |
|---|---|
| Letter “f” | Open the filter menu |
| Up and down arrows | Navigate through filter or values lists |
| Enter | Selection values |
| Esc | Close the filter menu |
Pre-made filters
At the top of the available filters list, you will find two pre-made filters : New today and Open.
We hope these two most used filters will save you time!
| Pre-made filter | Composition |
|---|---|
| Open | Status is any of all statuses in the Open and In Progress stages (e.g., Acknowledged, Ongoing, Pending in the default configuration) |
| New Today | Created at within Today |
List of all filters
Here is the updated list of all available filters.
| Filter | Composition |
|---|---|
| Asset | Lists impacted assets within the alert |
| Created at | Select a date of creation (date range, relative dates…) |
| Entity | Select entities where alerts happened that are listed in your alert table |
| Rule | Lists all rules that have raised alerts. You can also filter by a specific value by hovering on a value in the Source column in the table and clicking on the "+" button |
| Source | Lists all alert sources. You can also filter by a specific value by hovering on a value in the Source column in the table and clicking on the "+" button |
| Status | Lists all configured alert statuses. Default statuses include: Acknowledged, Closed, Ongoing, Pending, and Rejected |
| Target | Lists all alert targets. You can also filter by a specific value by hovering on a value in the Source column in the table and clicking on the "+" button |
| Threat | Lists all threats that are related to alerts. |
| Type | Lists all types of alerts present in the table. The type of rule is defined by the detection rule that triggered the alert. |
| Updated | Date of last update (date range, relative dates…) |
| Urgency | High [75-100], Medium (50-75], Low [0-50] |
Tip
To list only alerts raised by the same rule, just hover over the rule and click on the + next to the rule's name; it will automatically add the rule as a filter.
Add alerts to case in bulk
Users can add multiple alerts to a case to regroup all the needed information for an extensive investigation.
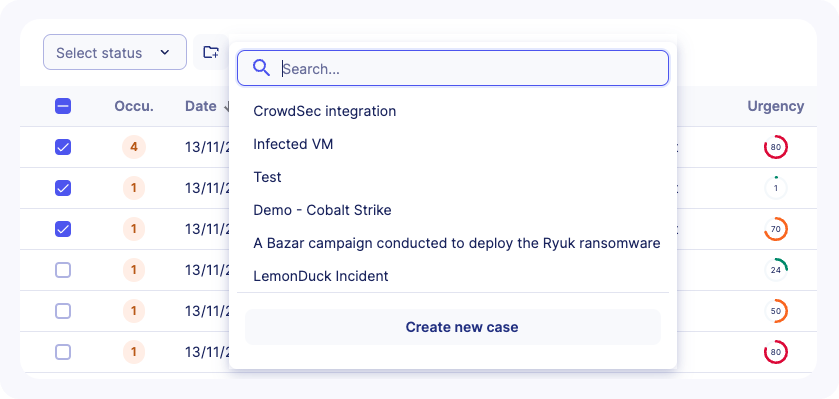
To add alerts to a case in bulk, follow these steps:
- Apply filters to alerts listing if needed
- Select some alerts in the list using the checkbox. A counter will let you know how many alerts are selected
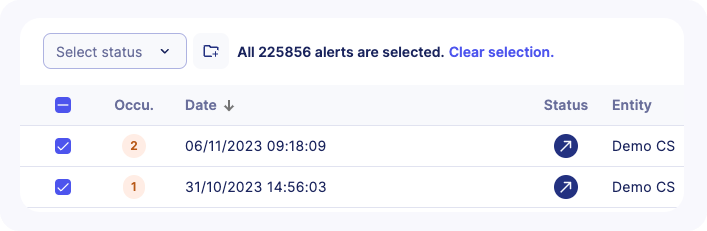
- You can select all available alerts (including alerts in other pages) by clicking on
Select all XX alerts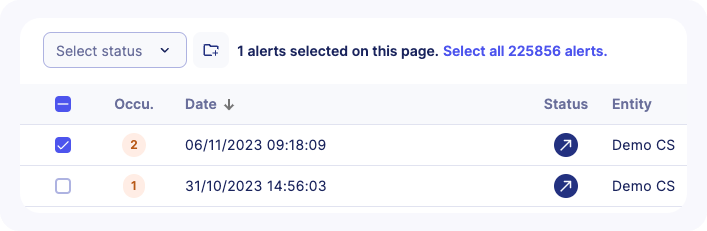
- A message will confirm that all alerts are selected including their count
- Choose an existing case or create a new case
Note
For multi-tenant communities, alerts can only be added to cases that belong to the same community.
Change alert status in bulk
On the main alert listing, it is possible to treat alerts faster. Users can, in one hand, change many alerts' statuses at the same time, and on the other hand, leave comments to explain their decision and provide more context.
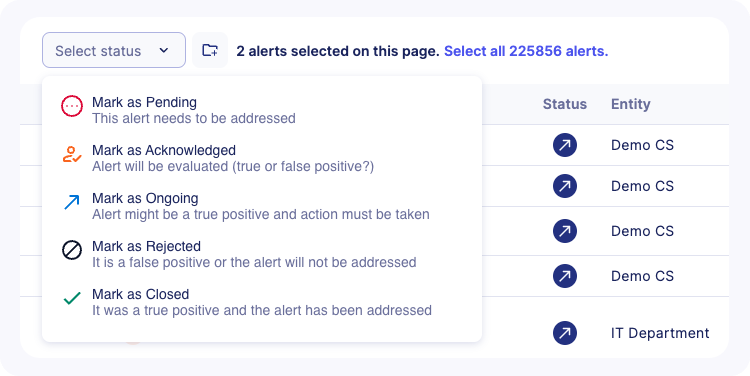
To change statuses in bulk, you have to:
- Apply filters to alerts listing if needed
- Select some alerts in the list using the checkbox. A counter will let you know how many alerts are selected
- You can select all available alerts (including alerts in other pages) by clicking on
Select all XX alerts - A message will confirm that all alerts are selected including their count
- Choose the new status you want to apply
- Leave a comment explaining your decision and click on the
Update statusbutton
Note
It is recommended to leave a comment to provide more context to the status change but it's not mandatory.
Alerts table columns
By default, the alert listing displays the following columns:
- A
Selectorso you can perform an action on multiple alerts on the same time - A
Similaritycounter, showing the alert was raised multiple time for the same reason, rather than simply adding a new line on the alert feed - Alert creation
Date - Alert
Status. When hovering over the icon, a frame indicates the status modification date and who modified it - The
Entityto which the alert corresponds Urgencyof the alert, between 0 and 100, 100 being the highest- The
Typeof alert - The
Nameof the rule which triggered the alert - The
Threatsrelated to the alert in termes of malicious activities, related tools, Campaign... - A
first seenandlast seendate - The
IDand theUUIDof the alert - The
sourceandtargetof the alert - The
Commu.which means the communities related to the alerts
Note
Your custom configuration will be saved in order to allow you to keep your selected filters when you come back to this page.
Tip
For Partners, an additional filter is available in order to display all or a subset of alerts related to their managed communities.
Alert details
The Alert Details page can be reached by clicking on any alert in the Alert Listing. This will provide you with a new view for quick and deep investigations.
The Alert Details header contains the urgency, the name and the short ID of the alert, as well as the following actions:
Alert Status: can be used to move the Alert through its lifecycle by changing its status to any configured statusAdd to case: add the alert to a case to gather all the needed information for an extensive investigationPlaybooks: display the list of on-demand playbooks and be able to trigger them.
Note
Playbooks that can be enabled on alerts are "manual" playbooks (ie with a Manual Trigger). They also have to be enabled in the community to appear in the UI.
The different sections of the page are then separated into 4 tabs: Details, Tasks, Events and Graph Investigation.
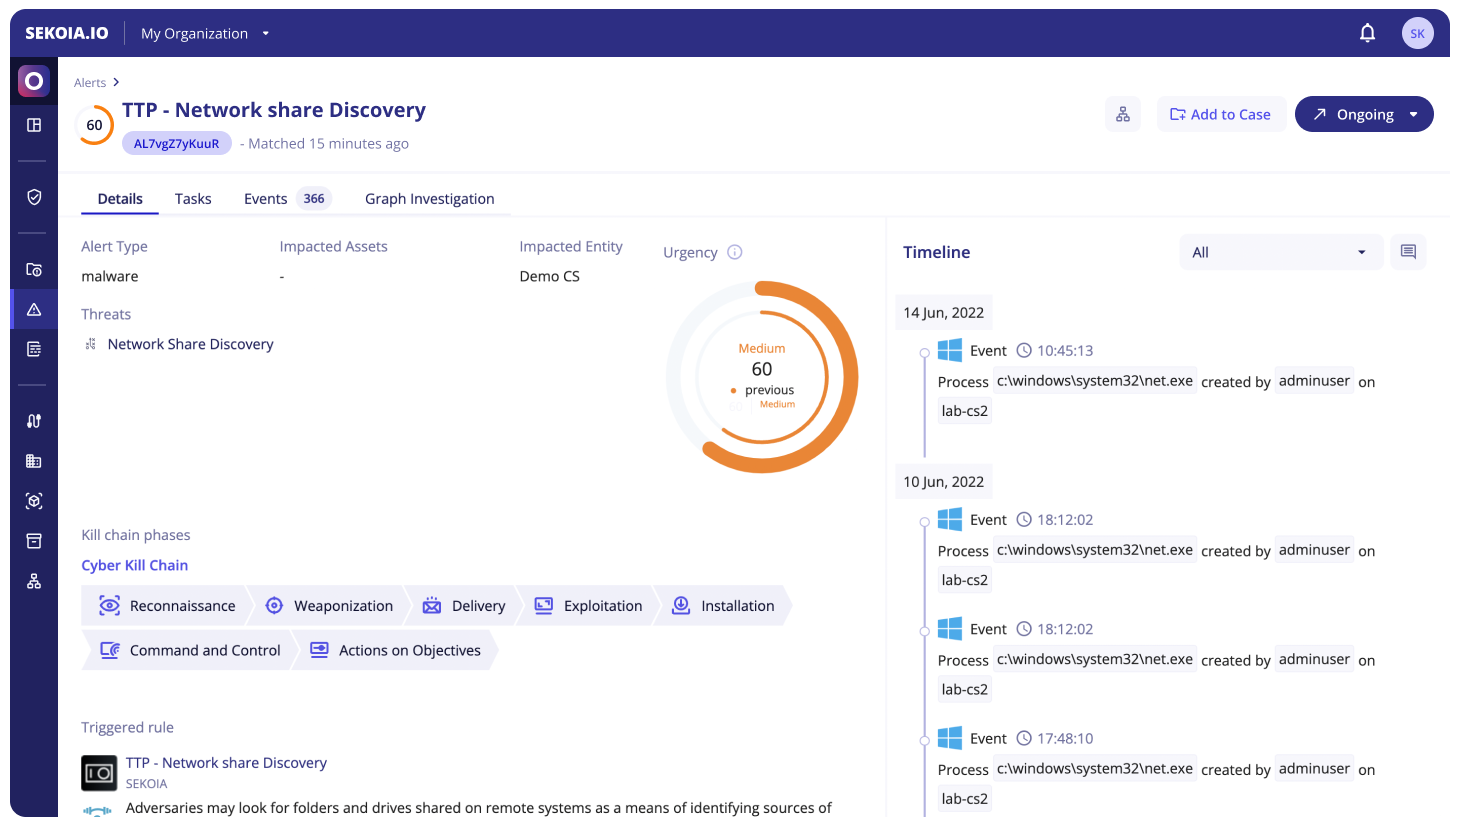
Details
The Details tab contains the information needed to understand what the alert is about and why it was raised. It’s split into two columns.
The first column contains the following items:
- The detailed alert urgency (can be edited on hover)
- The alert type
- The impacted assets
- The impacted entity
- The similarity strategy of the rule
- Related cases (cases in which this alert appears)
- The Kill Chain phase (can be edited on hover)
- Details about the rule that was triggered
- Details from the Intelligence Center about all threats linked to this alert
The second column is the timeline. It contains all items that constitute the history of the alert:
- Alert status changes
- Comments (that can be added with the button at the top right)
- Events represented by their Smart Descriptions
- Completed Tasks
- Rejected Tasks
It is possible to filter the timeline to display only items of a certain type.
Tasks
The Tasks tabs lists tasks and subtasks that are associated with the alert.
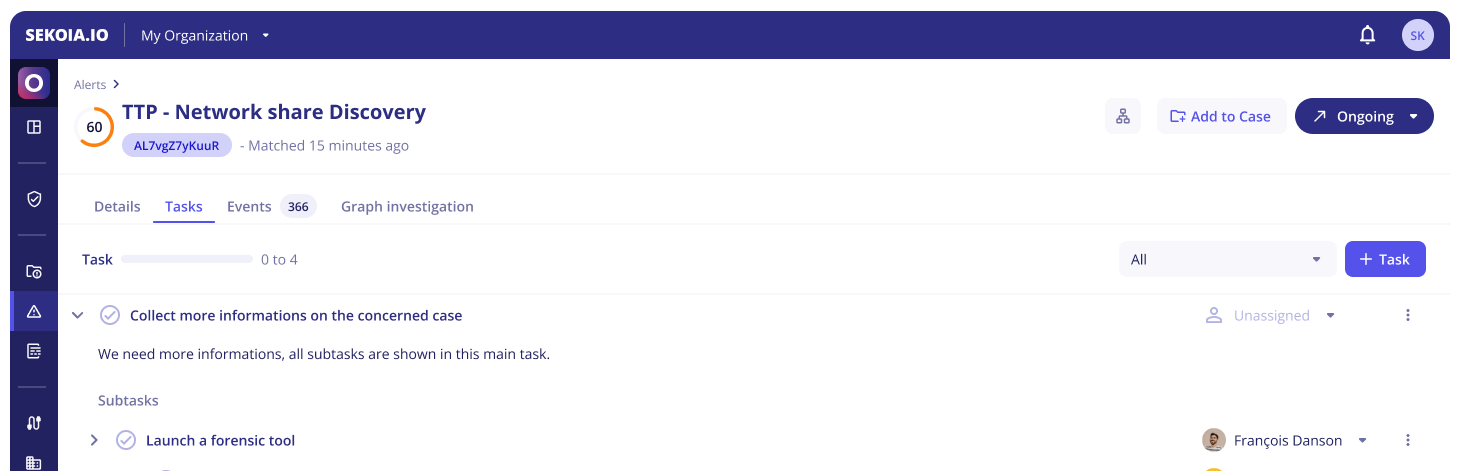
Buttons are available to complete or reject tasks. When completing a task, you are informing the Operations Center that you have undertaken the corresponding action on your perimeter. The urgency of the alert will thereby decrease, as well as the risk indicator.
Subtasks can have an OpenC2 specification which can be displayed by clicking on the automation icon.
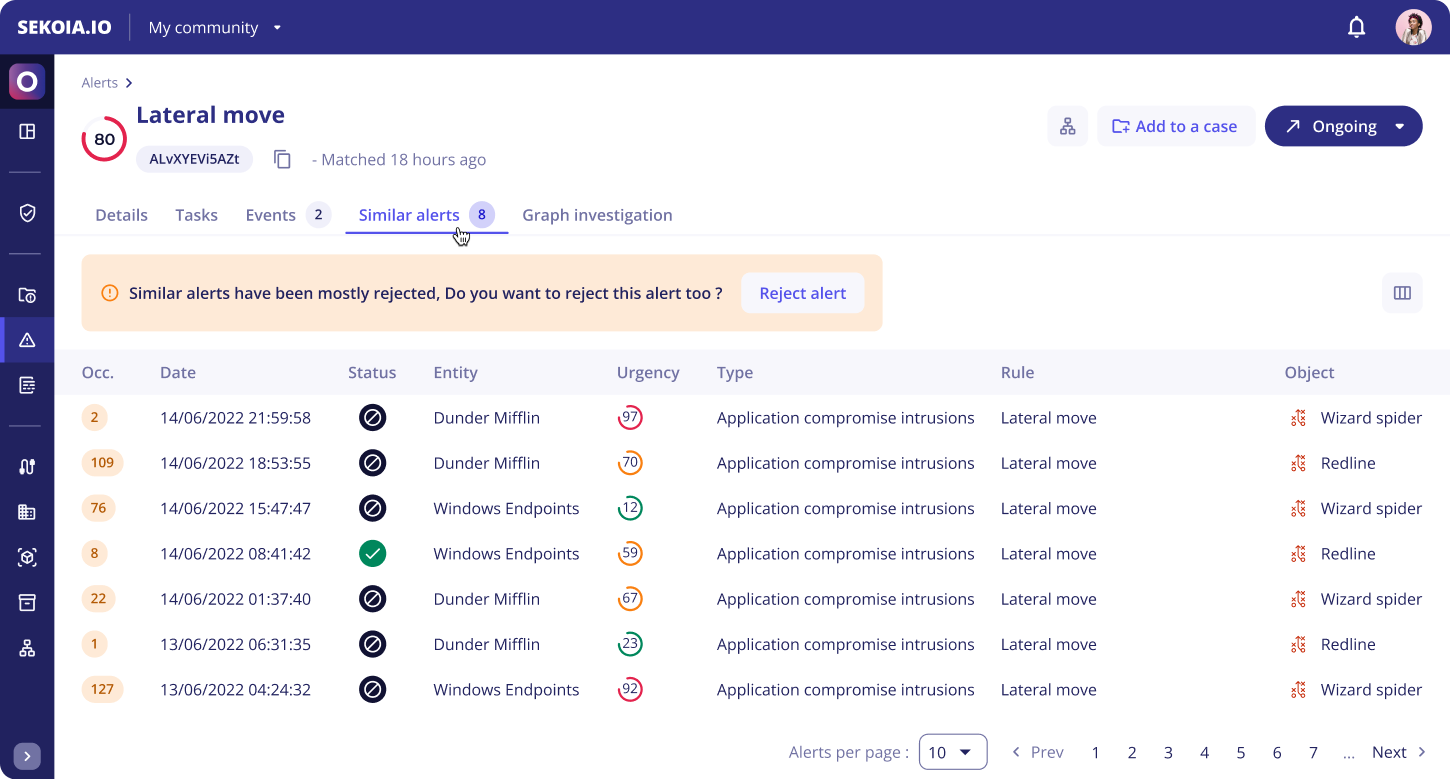
Similar alerts
Operators need as much information as possible to determine what to do with a new alert. With the similar alerts tab, Sekoia.io has that information in store and is able to display it to the operator in a comprehensive and useful way, while also providing recommendations based on the previous operator decisions.
To find similar alerts linked to a specific alert, you will need to access the detail page dedicated to this alert. The similar alerts tab will be automatically loaded next to the Details, Tasks, Graph Investigation and Events tabs.
To help you compare between alerts, you can choose which columns you want to display in the table by clicking on the icon in the upper right of the table.
Tip
You can click on the alerts to see the full details of a similar alert or open several of them in new tabs to compare them more easily.
The similar alerts tab is divided into two parts:
- The suggestion message: In a callout, you'll find a text that reminds you of the status of the majority of previous similar alerts. This message suggests you change the alert status based on the previous alerts. You can also find an action button to apply the status on your alert (except for alerts with statuses in the Closed stage).
- The similar alerts table: It gathers all the similar alerts that previously occurred. The columns of this table can be customized to help you investigate the similarities between alerts.
Note
Please note that if Sekoia.io doesn’t find previous similar alerts, a message will be displayed to notify you.
Events
The Events tab lists the events that raised the alert in a display similar to the Events page.
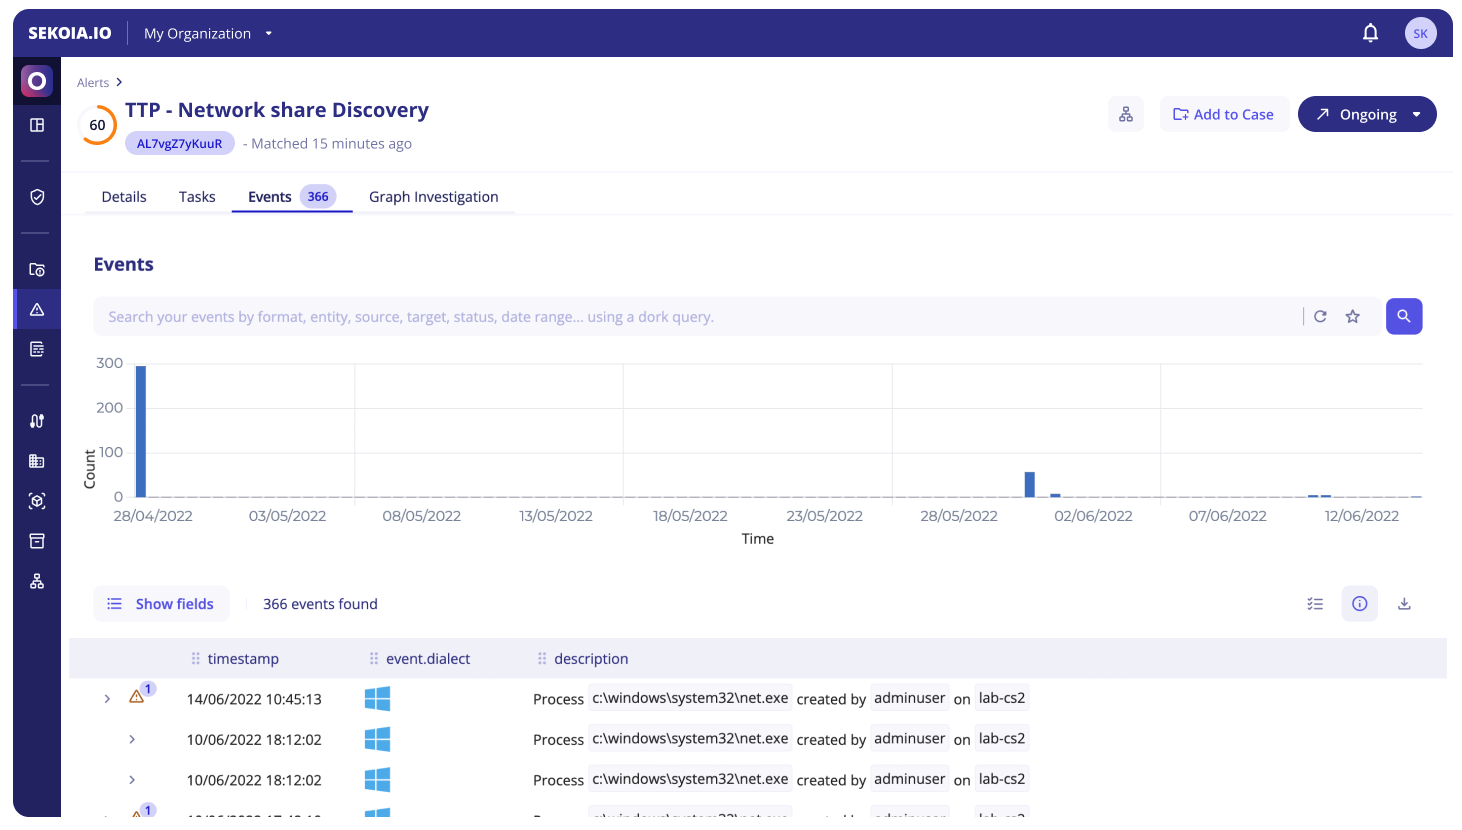
When interacting with individual values, it is possible to:
- Filter for: only applies to the events that raised the alert
- Filter out: only applies to the events that raised the alert
- Search events with this value
The Value Selection mode can be toggled with the button at the top right of the event list in order to select multiple values in displayed events. The selected values can then be used to:
Create an Alert Filter
Alert Filters can be used to prevent known false positives from raising the same alert in the future.
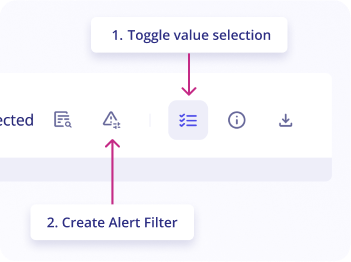
You can create an Alert Filter for the rule that triggered the alert by following these steps:
- On the
alertpage, go toeventstab - Click on
Toggle value selectionbutton in the upper right of the logs list - Select
valuesyou want to filter by clicking on them in the logs list - Click on the button
Create an Alert filteras shown in the screenshot - As the modal appears, fill in the
nameof the alert filter (mandatory) - Provide a
description(optional) - The filter's pattern is automatically created from selected values.
- Click on
Addto add this alert filter to the rule that triggered this alert
Note
By default, Reject the Alert is selected by default to automatically reject the alert after creating the Alert Filter.
Search Events with this value
The "Search Events with this value" feature can be used to perform a search into all events that occurred during the alert's timeframe (+- 1 hour).
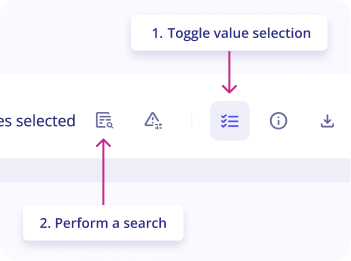
The search query is automatically created from selected values.
To search events with a value:
- On the
alertpage, go toeventstab - Click on
Toggle value selectionbutton in the upper right of the logs list - Select
valuesyou want to search for by clicking on them in the logs list - Click on the button
Perform a searchas shown in the screenshot
A side panel opens with the search results, allowing you to investigate an alert without leaving the page.
Graph Investigation
The Graph Investigation tab provides analysts with an interactive graphical visualization of the alert, enabling comprehensive threat analysis through visual correlation of security events and intelligence data.
Note
All changes performed within the Graph Investigation are automatically saved. The graph updates dynamically with each visit based on the events associated with the alert. Any new objects discovered through additional events are automatically integrated into the existing graph structure.
Graph Elements
The graph displays the following interconnected elements:
-
Observables: Security artifacts automatically extracted from events, including IP addresses, domain names, URLs, user accounts, file hashes, and other indicators of compromise
-
Observable Relationships: Visual connections between observables represented by directional arrows. These relationships are extracted from events using Smart Description definitions that parse event data to identify logical connections
-
CTI Objects: STIX-compliant threat intelligence objects from the Intelligence Database that enrich the analysis with contextual threat information
-
STIX Relationships: Standardized connections between threat intelligence objects that reveal the broader threat landscape
Threat Intelligence
Access comprehensive threat intelligence by clicking on any CTI object within the graph. The left panel immediately displays:
-
Detailed object descriptions and threat context
-
Complete relationship mappings with other intelligence objects
-
Interactive options to expand the graph by adding related objects
This functionality enables pivoting through the threat intelligence database, allowing analysts to explore the full scope of related threats and campaigns.
Observable Analysis
Investigate specific observables by clicking on any observable node in the graph. The left panel provides:
-
Event Context: All events within the alert that contain the selected observable, presented with Smart Description summaries for quick comprehension
-
Full Event Details: Complete event information accessible through the right-side panel via the "Full Events" button
-
Extended Search: Direct access to search for additional events containing the same observable value across your entire environment
This multi-layered approach ensures analysts can quickly understand both the immediate context and broader implications of each observable.
Layers Management
Layers enhance analytical efficiency by organizing complex graphs into manageable, focused sections that can be viewed independently or in combination.
Understanding Layers
Layers represent logical groupings within your graph that can be selectively displayed or hidden. This feature transforms complex visualizations into organized, digestible sections while maintaining the ability to view the complete picture when needed.
Default Layer Behavior
Every graph investigation automatically creates a default layer upon first access. This foundational layer:
- Serves as the primary container for initial graph elements
- Automatically incorporates new objects as additional events are processed
- Maintains continuity across investigation sessions
Active Layer Management
The layer control interface, located in the top-left corner adjacent to the main panel, provides:
- Layer Panel Access: One-click access to the complete layer management interface
- Active Layer Indicator: Clear identification of the currently selected layer where new additions will be placed
- Seamless Layer Switching: Instant transitions between different analytical perspectives
Creating and Managing Layers
To create and organize layers:
- Click the name of the default layer in the top-left of the graph (e.g. Event Layer #1)
- Select the “+” button to add a new layer
- Enter a name for your layer.
- Drag and drop objects or observables into the layer of your choice.
All changes are saved automatically—no manual action required.
Viewing Layer Content
- To focus only on the contents of a specific layer, toggle visibility by clicking the Eye icon.
Use this functionality to reduce visual clutter and isolate relevant data for deeper analysis.
Strategic Layer Usage for Alerts
Optimize your alert investigation by implementing these layer organization strategies:
- Observable Type Segregation: Create separate layers for different observable categories (network indicators, file artifacts, user activities) to isolate analysis domains
- Temporal Analysis: Organize layers by time periods to understand attack progression and identify patterns across different phases
- Threat Actor Attribution: Separate layers for different suspected threat actors or attack techniques when multiple threats are identified
Advanced Layer Features
-
Visibility Control: Toggle individual layer visibility to focus analytical attention on specific aspects while temporarily hiding others
-
Cross-Layer Movement: Relocate misplaced objects between layers to maintain optimal organization as your investigation evolves
-
Dynamic Renaming: Update layer names throughout the investigation to reflect evolving understanding and maintain clear organization
-
Intelligent Search: Utilize the built-in search functionality to quickly locate specific objects within large, multi-layered graphs, essential for complex investigations with extensive observable networks
These enhanced capabilities ensure that even the most complex alert investigations remain manageable and analytically productive.