Intakes
Intakes correspond to data sources sent to Sekoia.io. They are identified by a name, an intake format, an entity and an intake key.
You can configure as much intakes as you need in order to increase Sekoia.io knowledge of your infrastructure.
All features related to intakes are visible through the “Intakes” menu.
Intakes listing
The intakes homepage allows you to view and manage the list of intakes already created within the community but also to create new intakes.
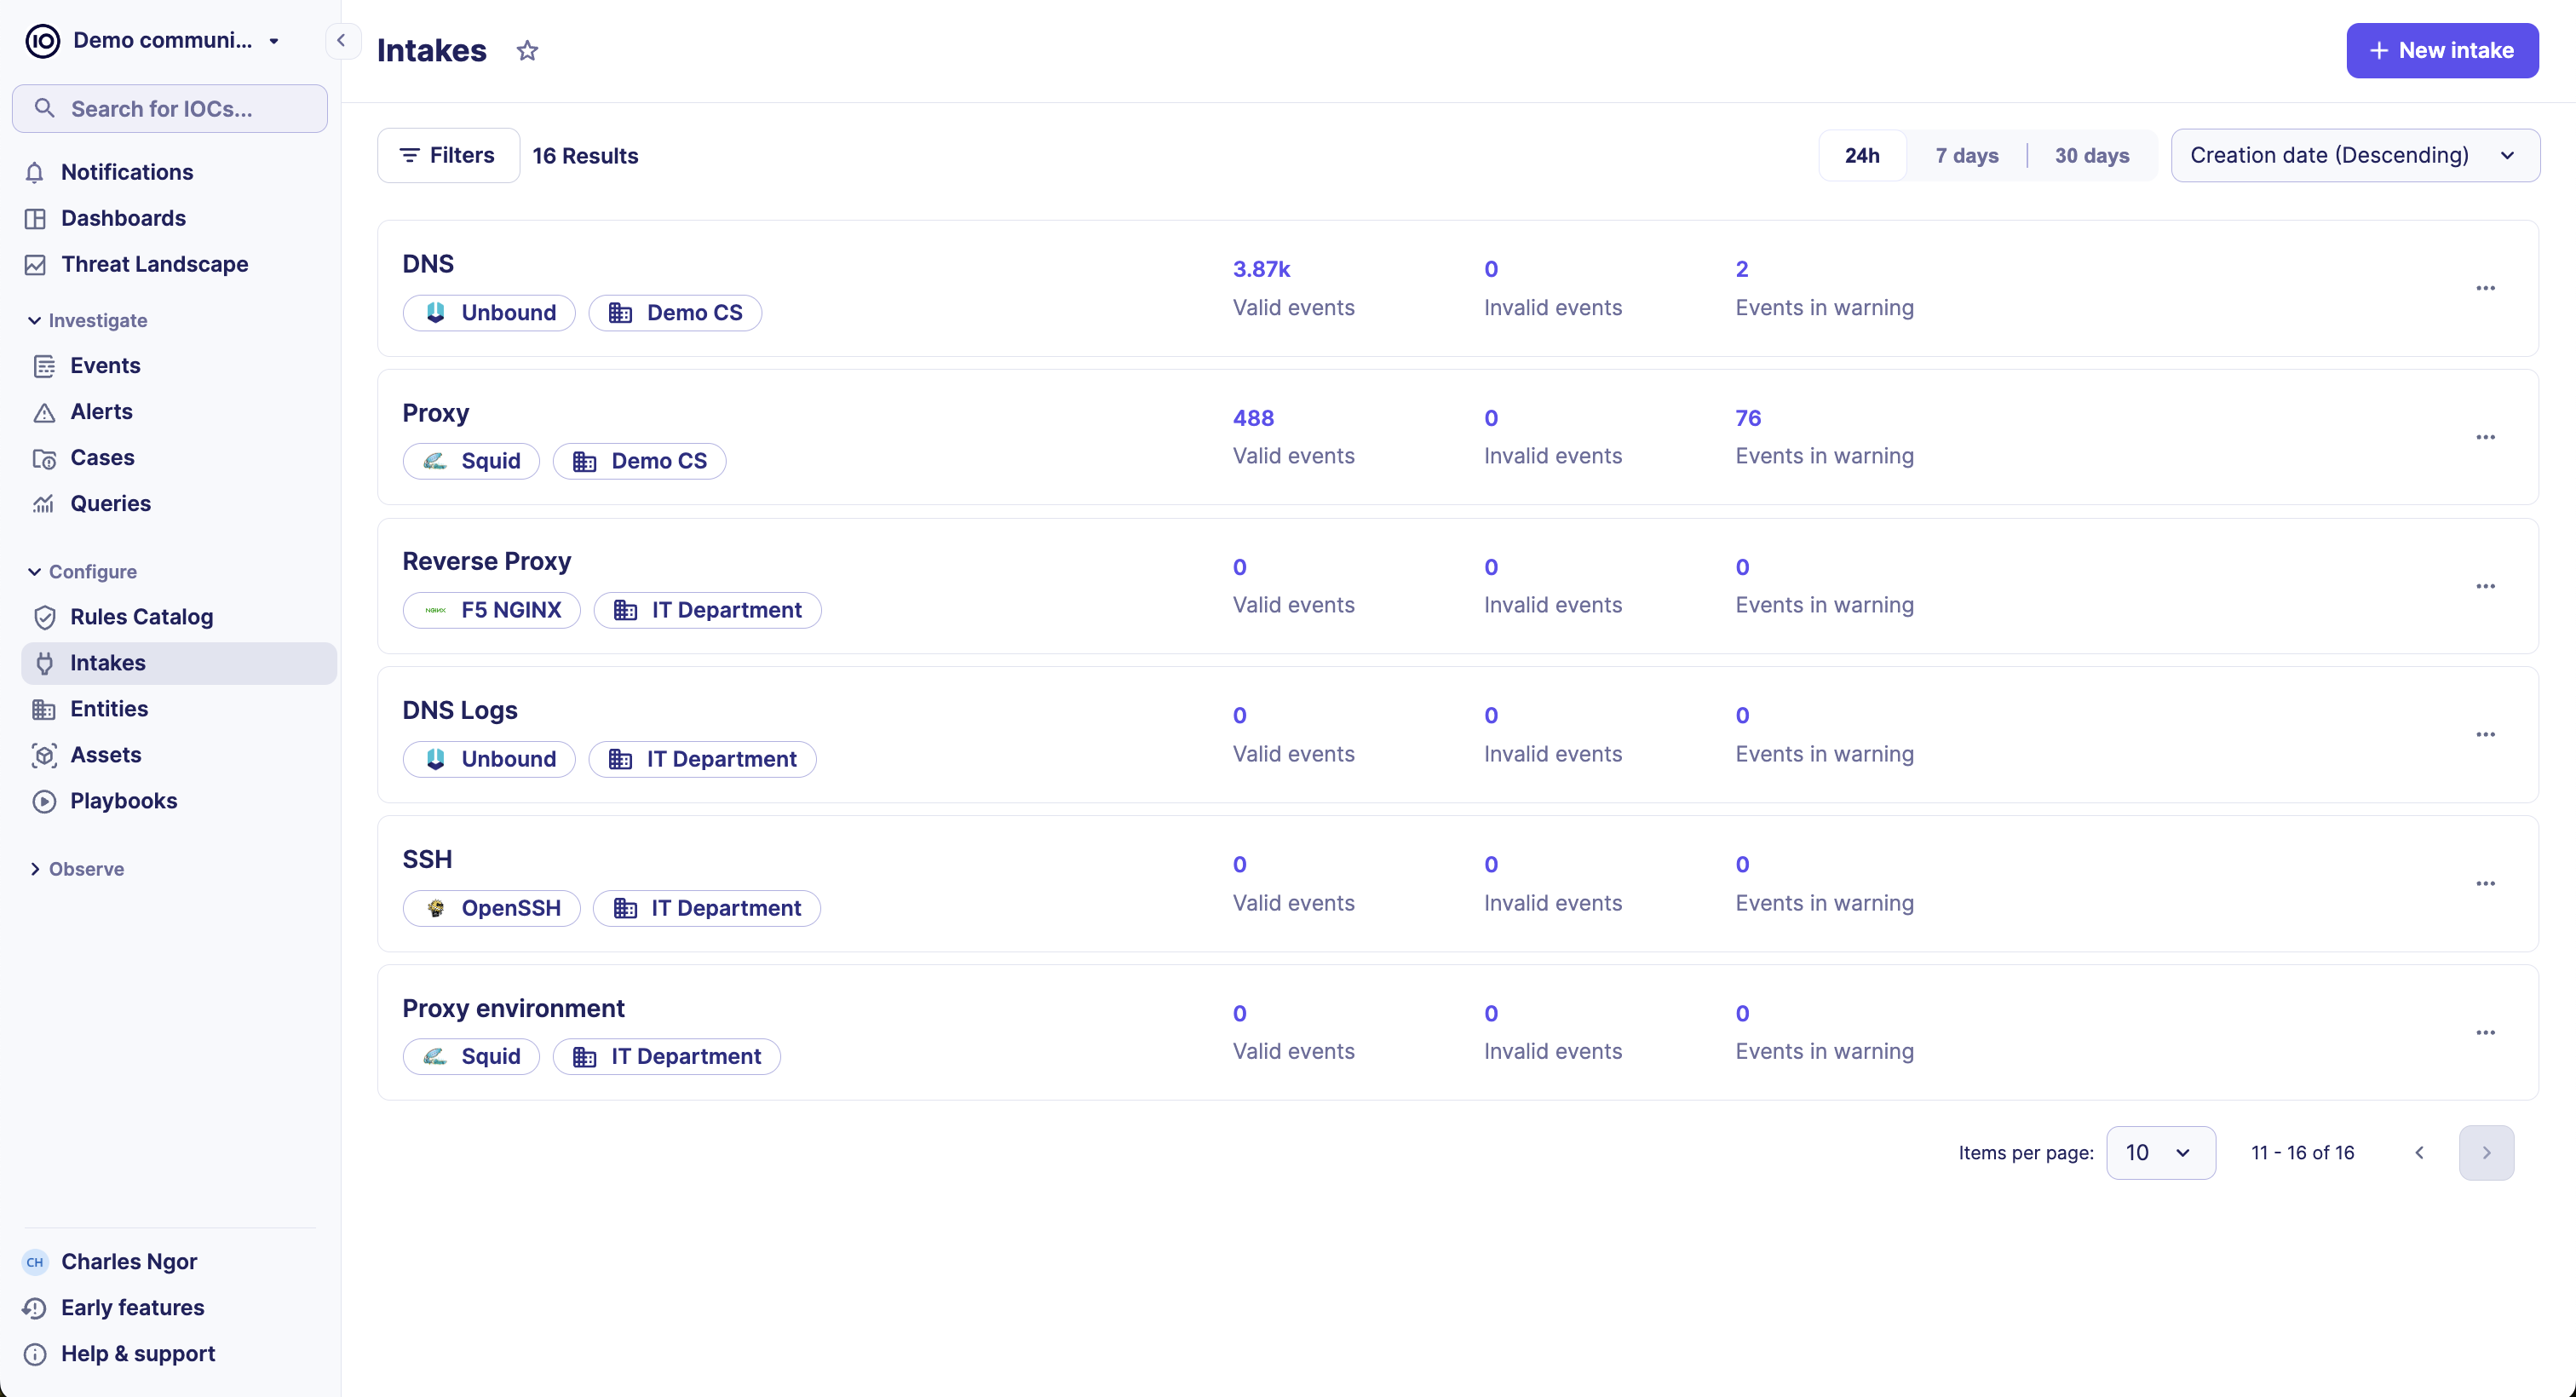
On this page, you can find:
- The created intakes in your community with their associated entity
- The number of
valid events - The number of
invalid events - The number of
events in warning

Event types
Invalid event
An event is invalid when the data does not match the expected format (JSON, Key value, Grok, Date, Delimiter separated value).
Event in warning
A warning can be generated in 2 cases:
- The parsing of the event was a success but no data were extracted
- Some values were incompatibles with their expected data type and could not be extracted
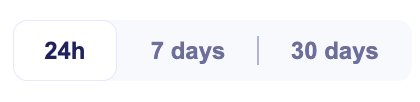
Events date range
Use the date range selector to view the number of events in different timeframes (24h, 7 days or 30 days). This date range selector will help you to assess if the volume of ingested logs has the expected behavior.
Intake types
The Integration catalog contains two different types of intakes. These 2 types differs on the method of collecting the events.
Push intake
With Push intakes, logs must be forwarded by the user to Sekoia with one of our forwarding methods (Syslog, Sekoia concentrator, etc..).
Pull intake
With Pull intakes, logs are collected directly by Sekoia with a connector. The connector usually uses a REST API to collect data. In other words Sekoia SOC platform is fetching the logs for the user this case.
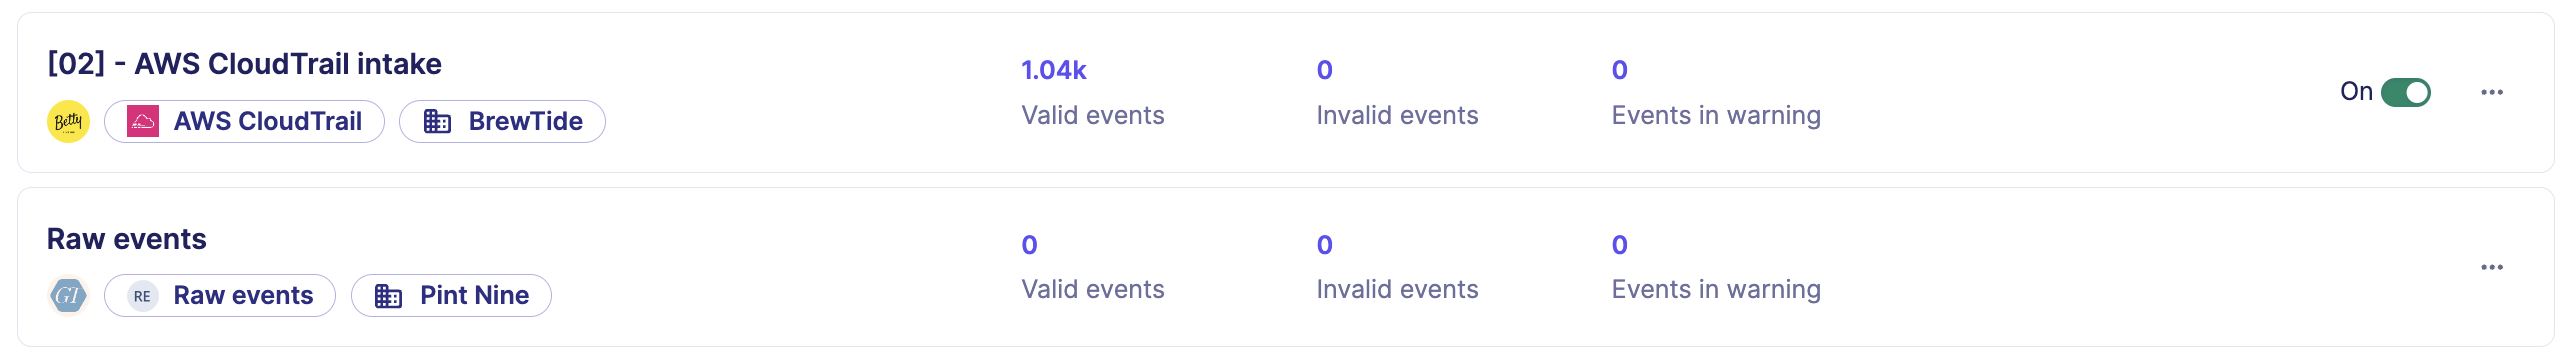
Pull intakes are distinguishable by their On/Off button and Connect log tab.
Start/Stop a Pull intake
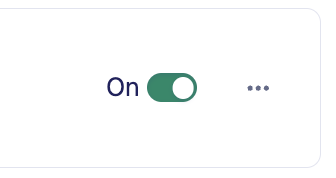
Pull intakes have a On/Off button which allows you to enable or disable the collection of data. Pull intakes have a connector that regularly pulls the logs from your data source.
Error status
When a Pull intake is fetching logs, it can encounter different kind of issues. The error status will help you understand the current state of the connector.
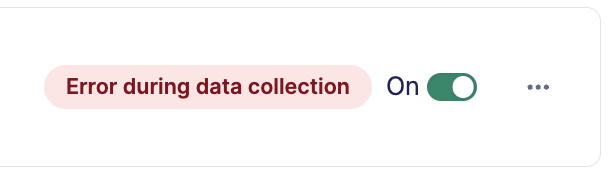
| Status | Description |
|---|---|
| Error during data collection | Some errors were encountered during data collection but the connector is still running. A verification by the user may be needed to fix the issues. |
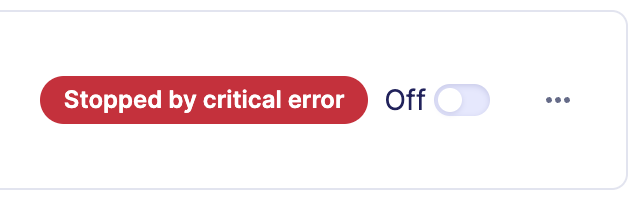
| Stopped by critical error | The connector was stopped because of a critical error. An urgent action is required by the user to investigate and fix the issues. Note that if too many errors are encountered, the connector will consider them as a critical error. |
To troubleshoot the origin of these errors and restore data collection, you can use the connector log tab.
Filters
Multiple filters are available to search for specific intakes.
| Filter | Description |
|---|---|
| Created at | Filter intakes by their date of creation (date range, relative dates…) |
| Entity | Filter intakes by associated entities |
| Intake format | Filter intakes by their intake formats. An intake format corresponds to a specific product |
| Intake key | Filter intakes by their intake key. An intake key is the unique identifier used to identify to which intake a log belong |
| Status | Filter intakes by their status. Available status are: Running, Stopped, Error during data collection and Stopped by critical error |
| UUID | Filter intakes by their UUID. A UUID is a unique identifier of an intake. |
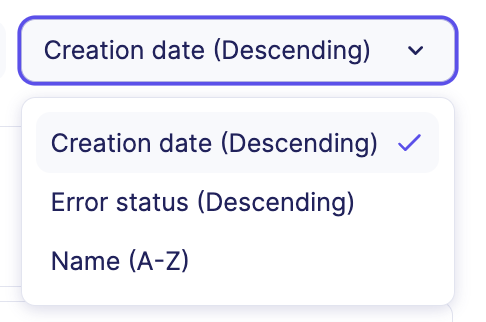
Ordering
The list of intakes can be ordered by:
- Creation date (in descending order)
- Error status (in this order: Stopped by critical error, Error during data collection)
- Name (in alphabetical order)
Create an intake from our integrations catalog
To configure a new data source in your community, you can rely on our list of continuously growing integrations that are constantly developed and enhanced by Sekoia.io’s team.
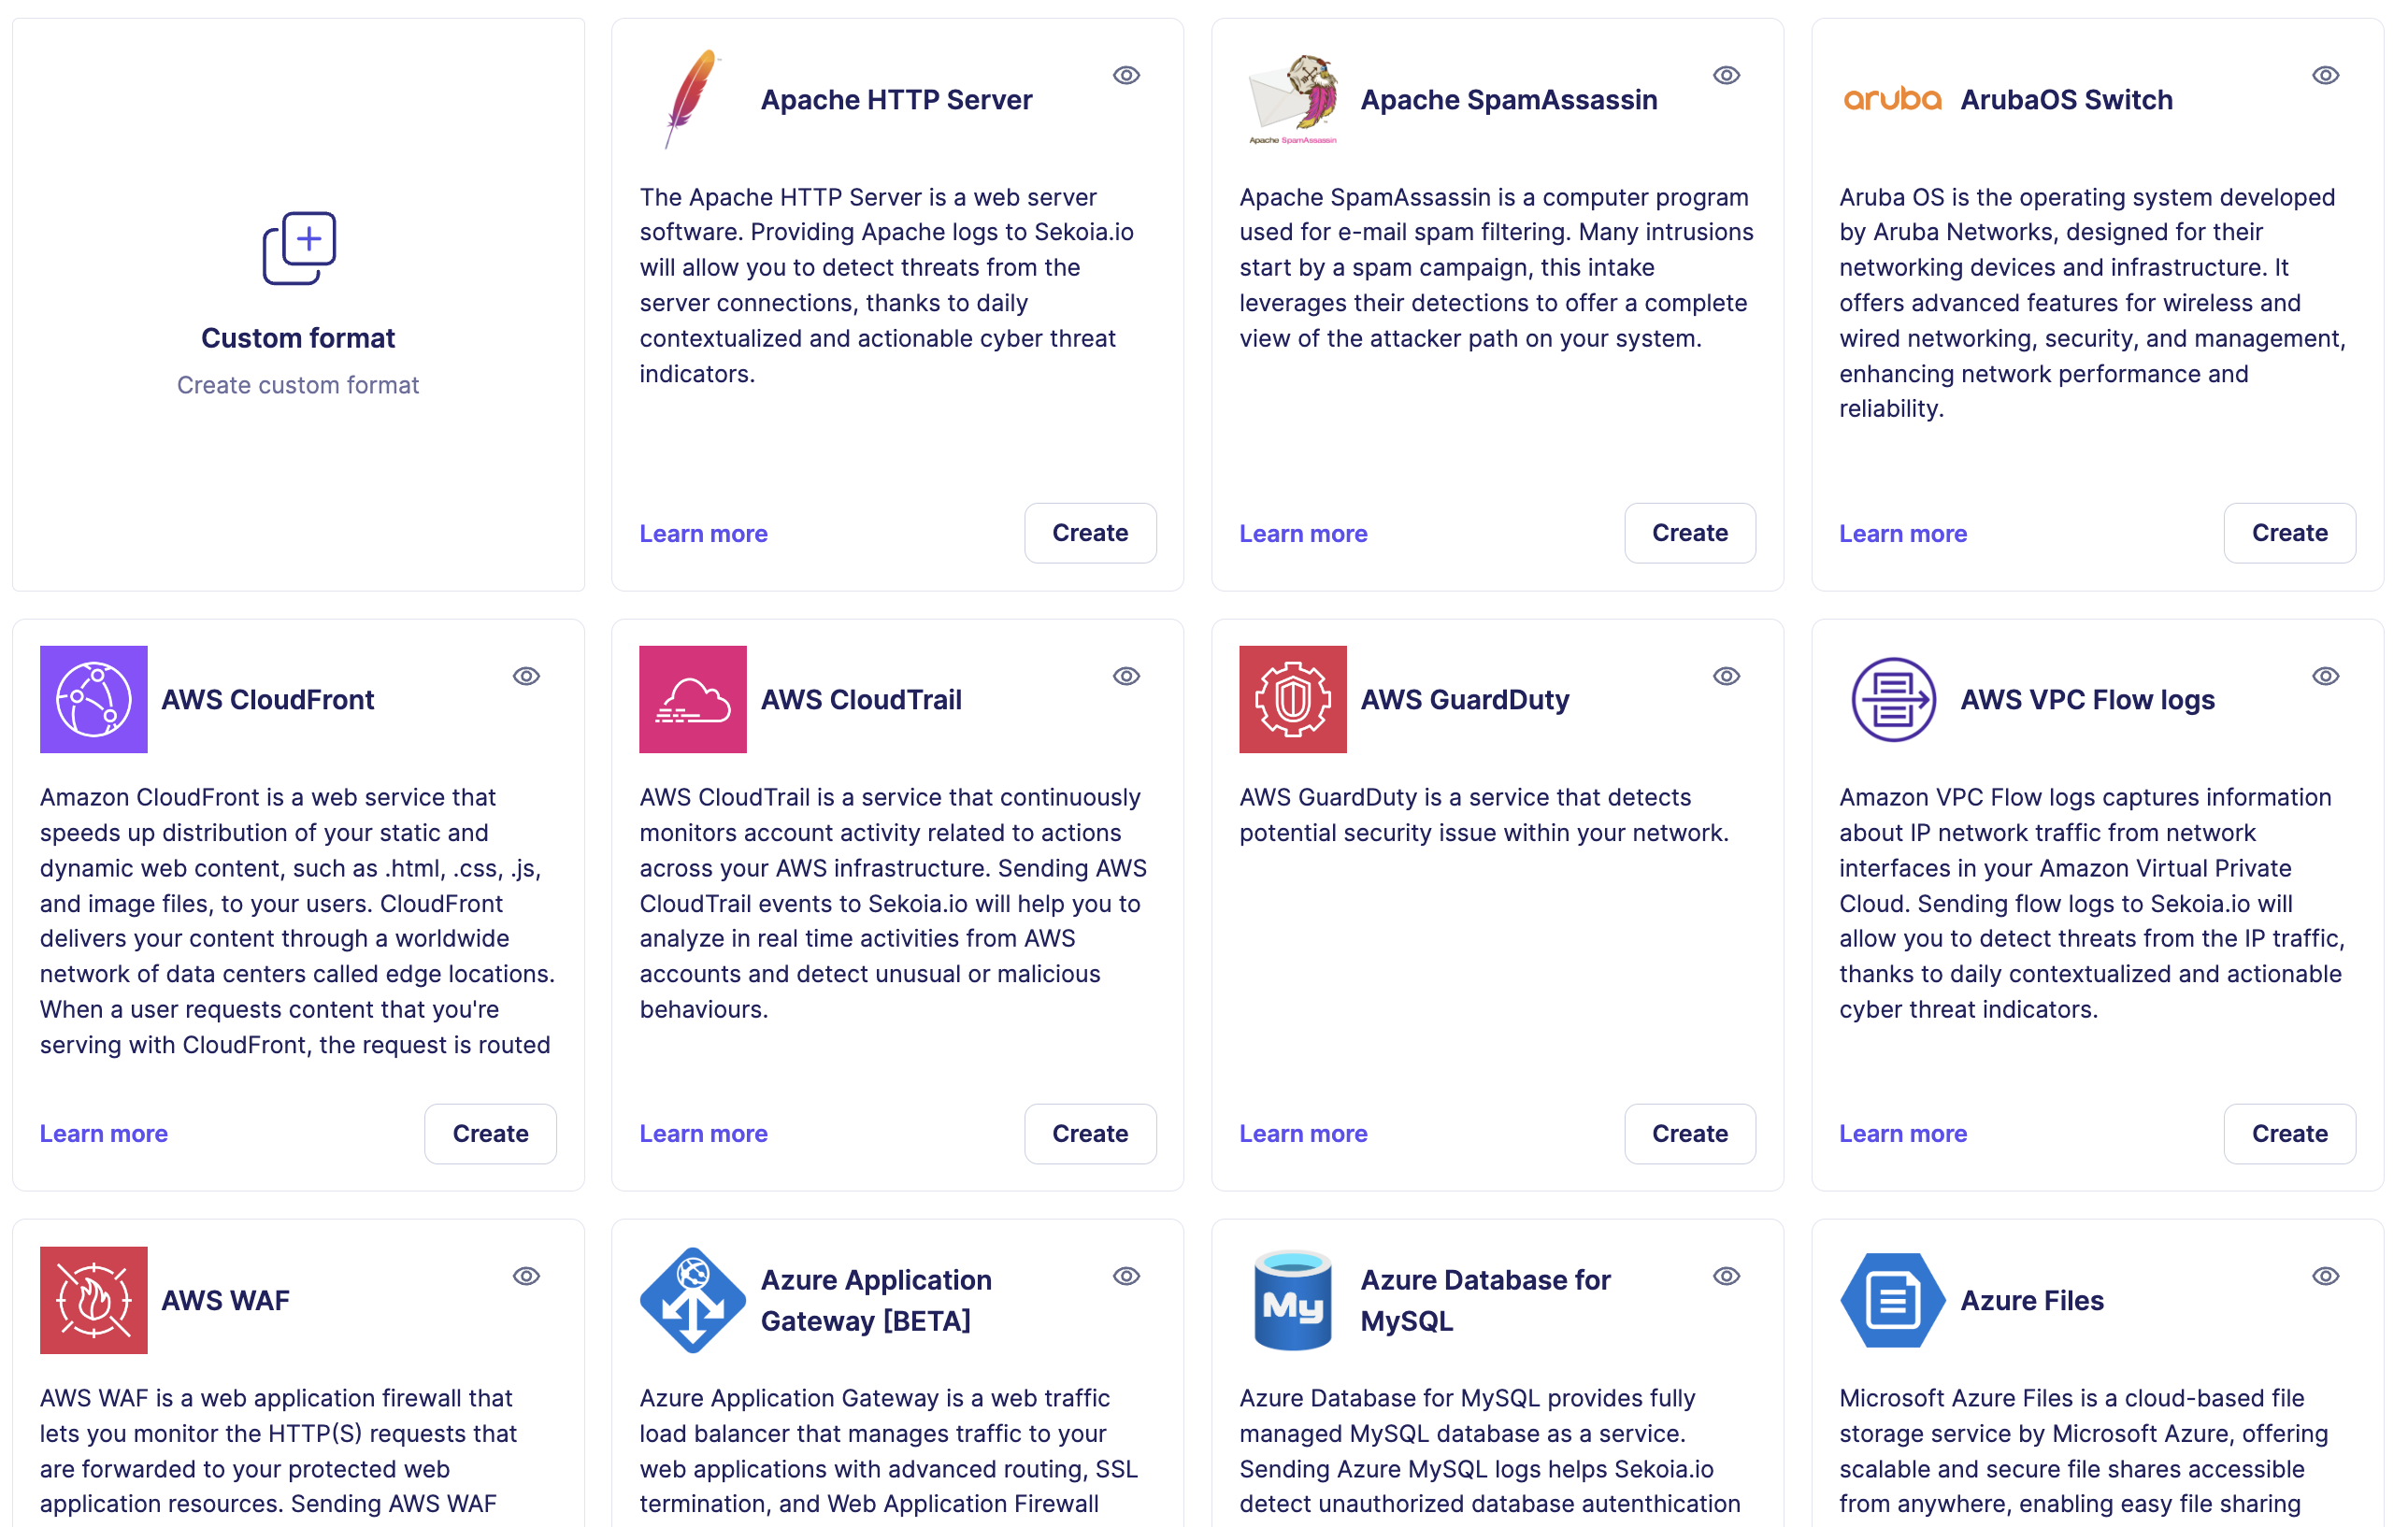
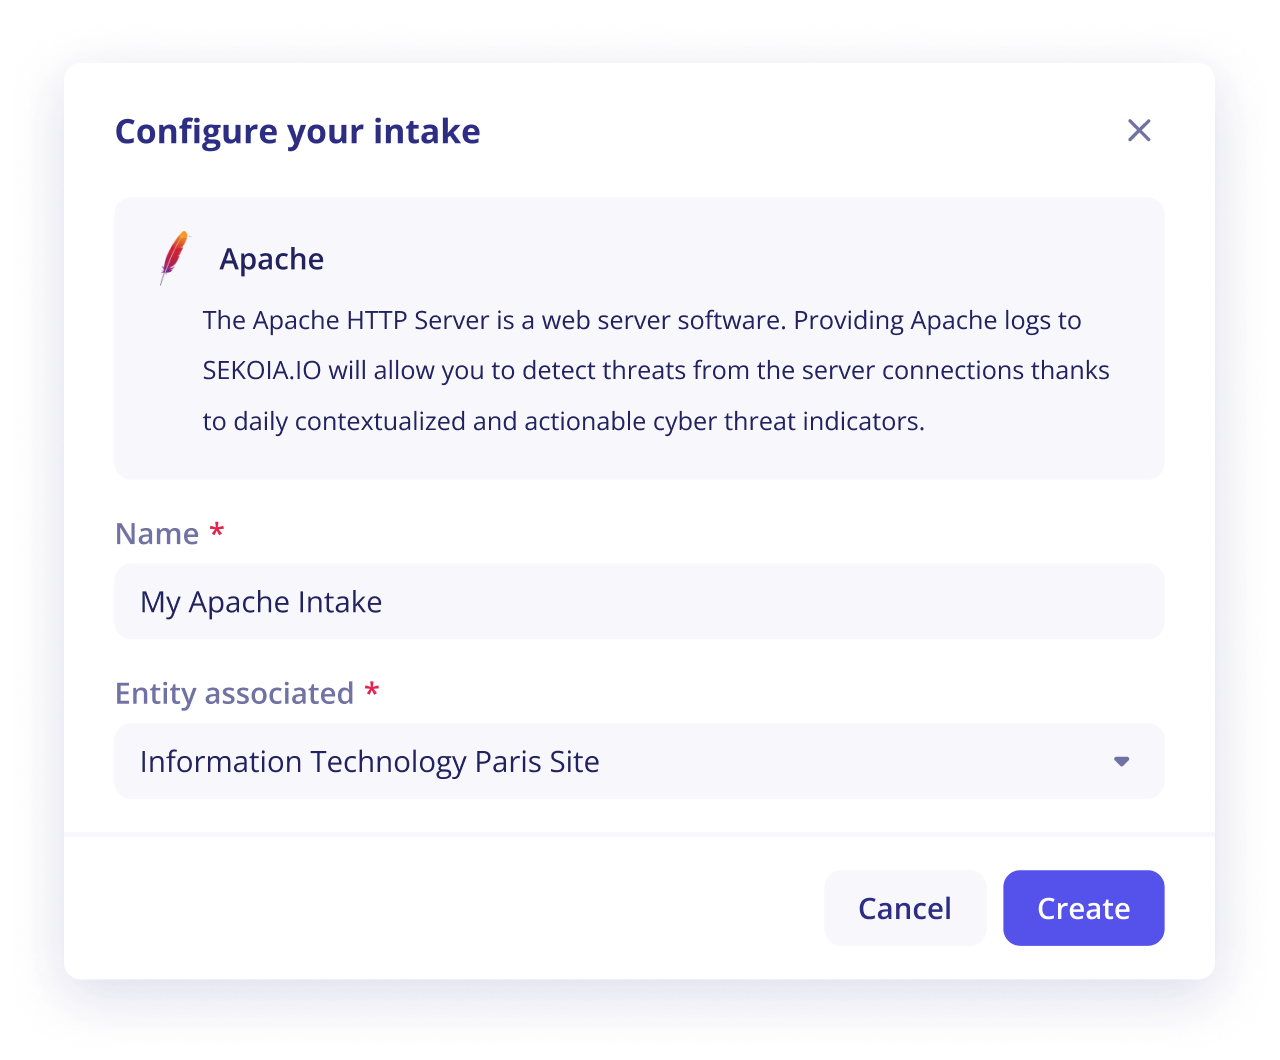
To create an intake, you have to:
- Click on the
+ Intakefrom the Intakes homepage - Choose the data source that suits your needs (you can filter these data sources by clicking on the categories’ tags)
- Click on the
Createbutton in the card - Provide an intelligible name
- Select the entity to which you want to associate the corresponding data
- Click on
Create - (optional) For Pull intakes which requires a connector, you will need to provide configuration parameters to access the data source
Note
The documentation about the integration of your data sources is also available in the integrations page.
Pin
Configure a notification to report on inactive intake
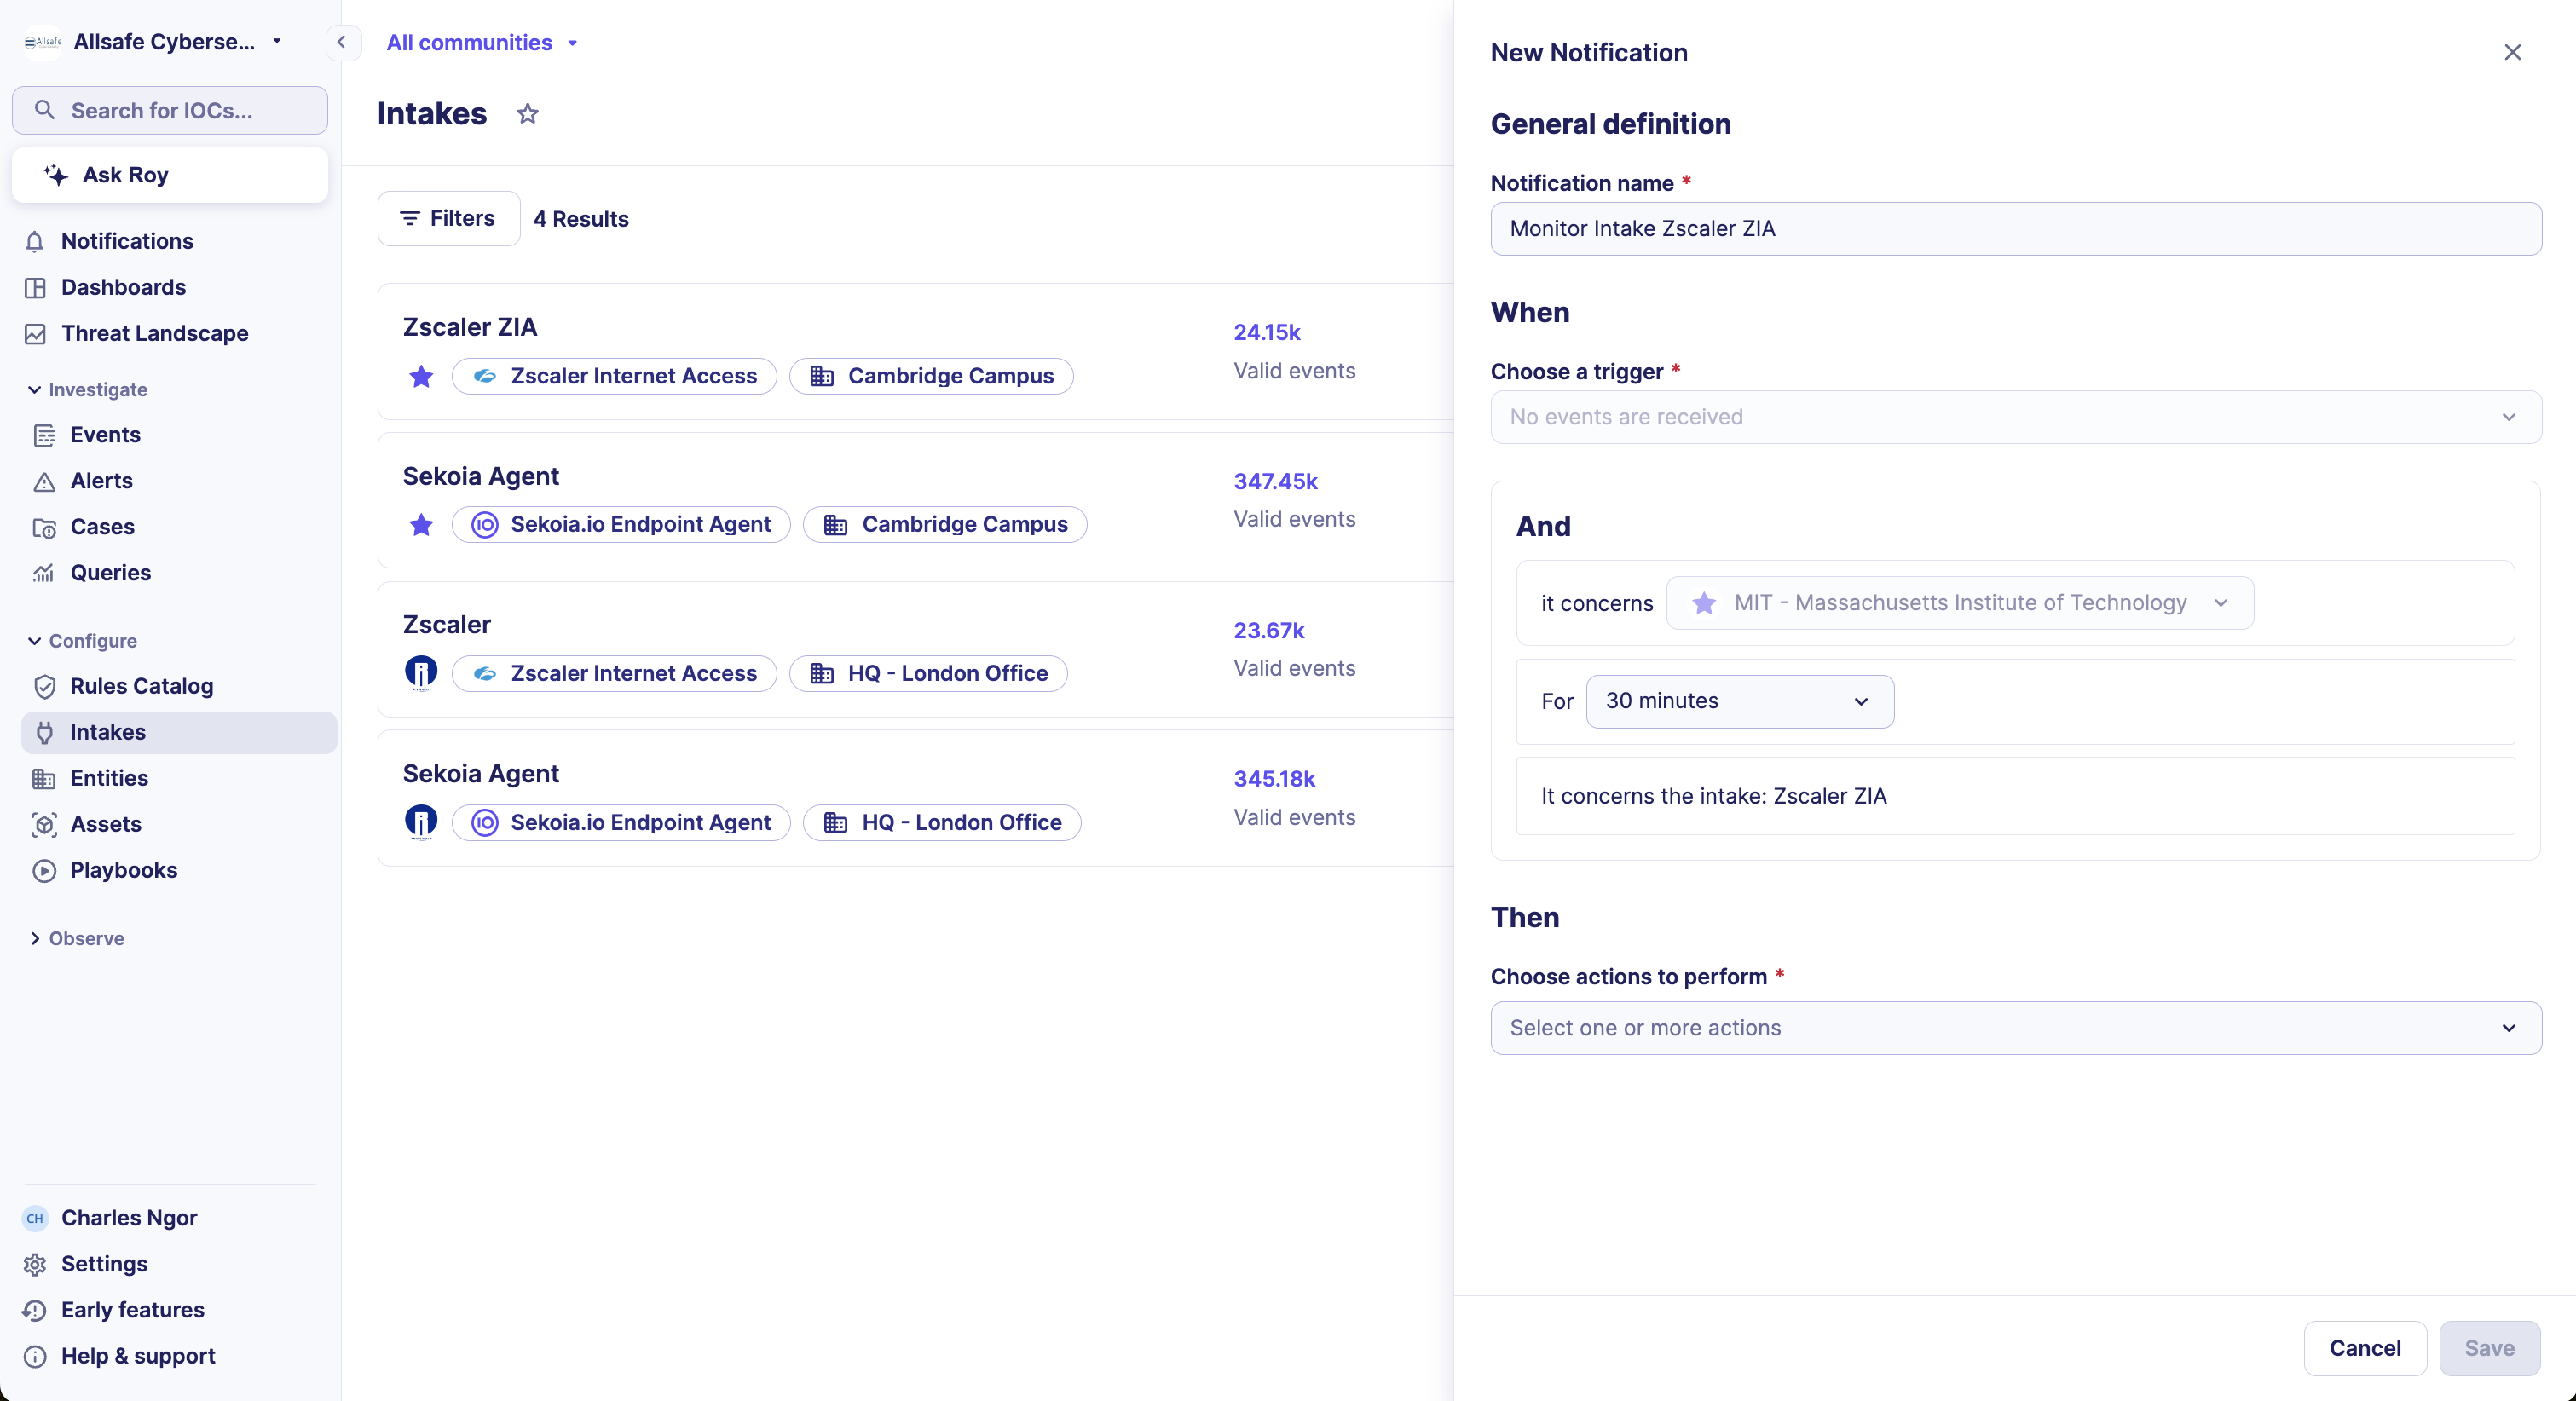
An inactive intake may have devastating consequences on your security monitoring. To prevent incidents from happening, you can set up notifications to get alerted when an intake stops sending events to Sekoia.io.
To set up your notification, you can:
- Go to the Intakes listing page and click on:
 on the right side of the card and click on the
 Notificationsmenu - Specify how long the intake should be inactive before sending a notification. The duration can go from 15 min to 24 hours.
- Select how you want to be notified. Triggered actions that are available are mentioned in the page Turn on notifications.
Note
You can also set up this notification from the intake details page or the User Center > Notifications by selecting the trigger No events are received.
Create a custom intake
To learn more about how to create a custom intake, please refer to this section.
Intake details page
The details page of an intake provides key infos to check the health state of your data source collection. These infos are:
- The volume of ingested events in a visual graph
- The volume of events invalid or in warning
- An event delivery metric which indicates the lag of event delivery
- The latest ingested events
- The logs of the connector (for Pull intakes only)
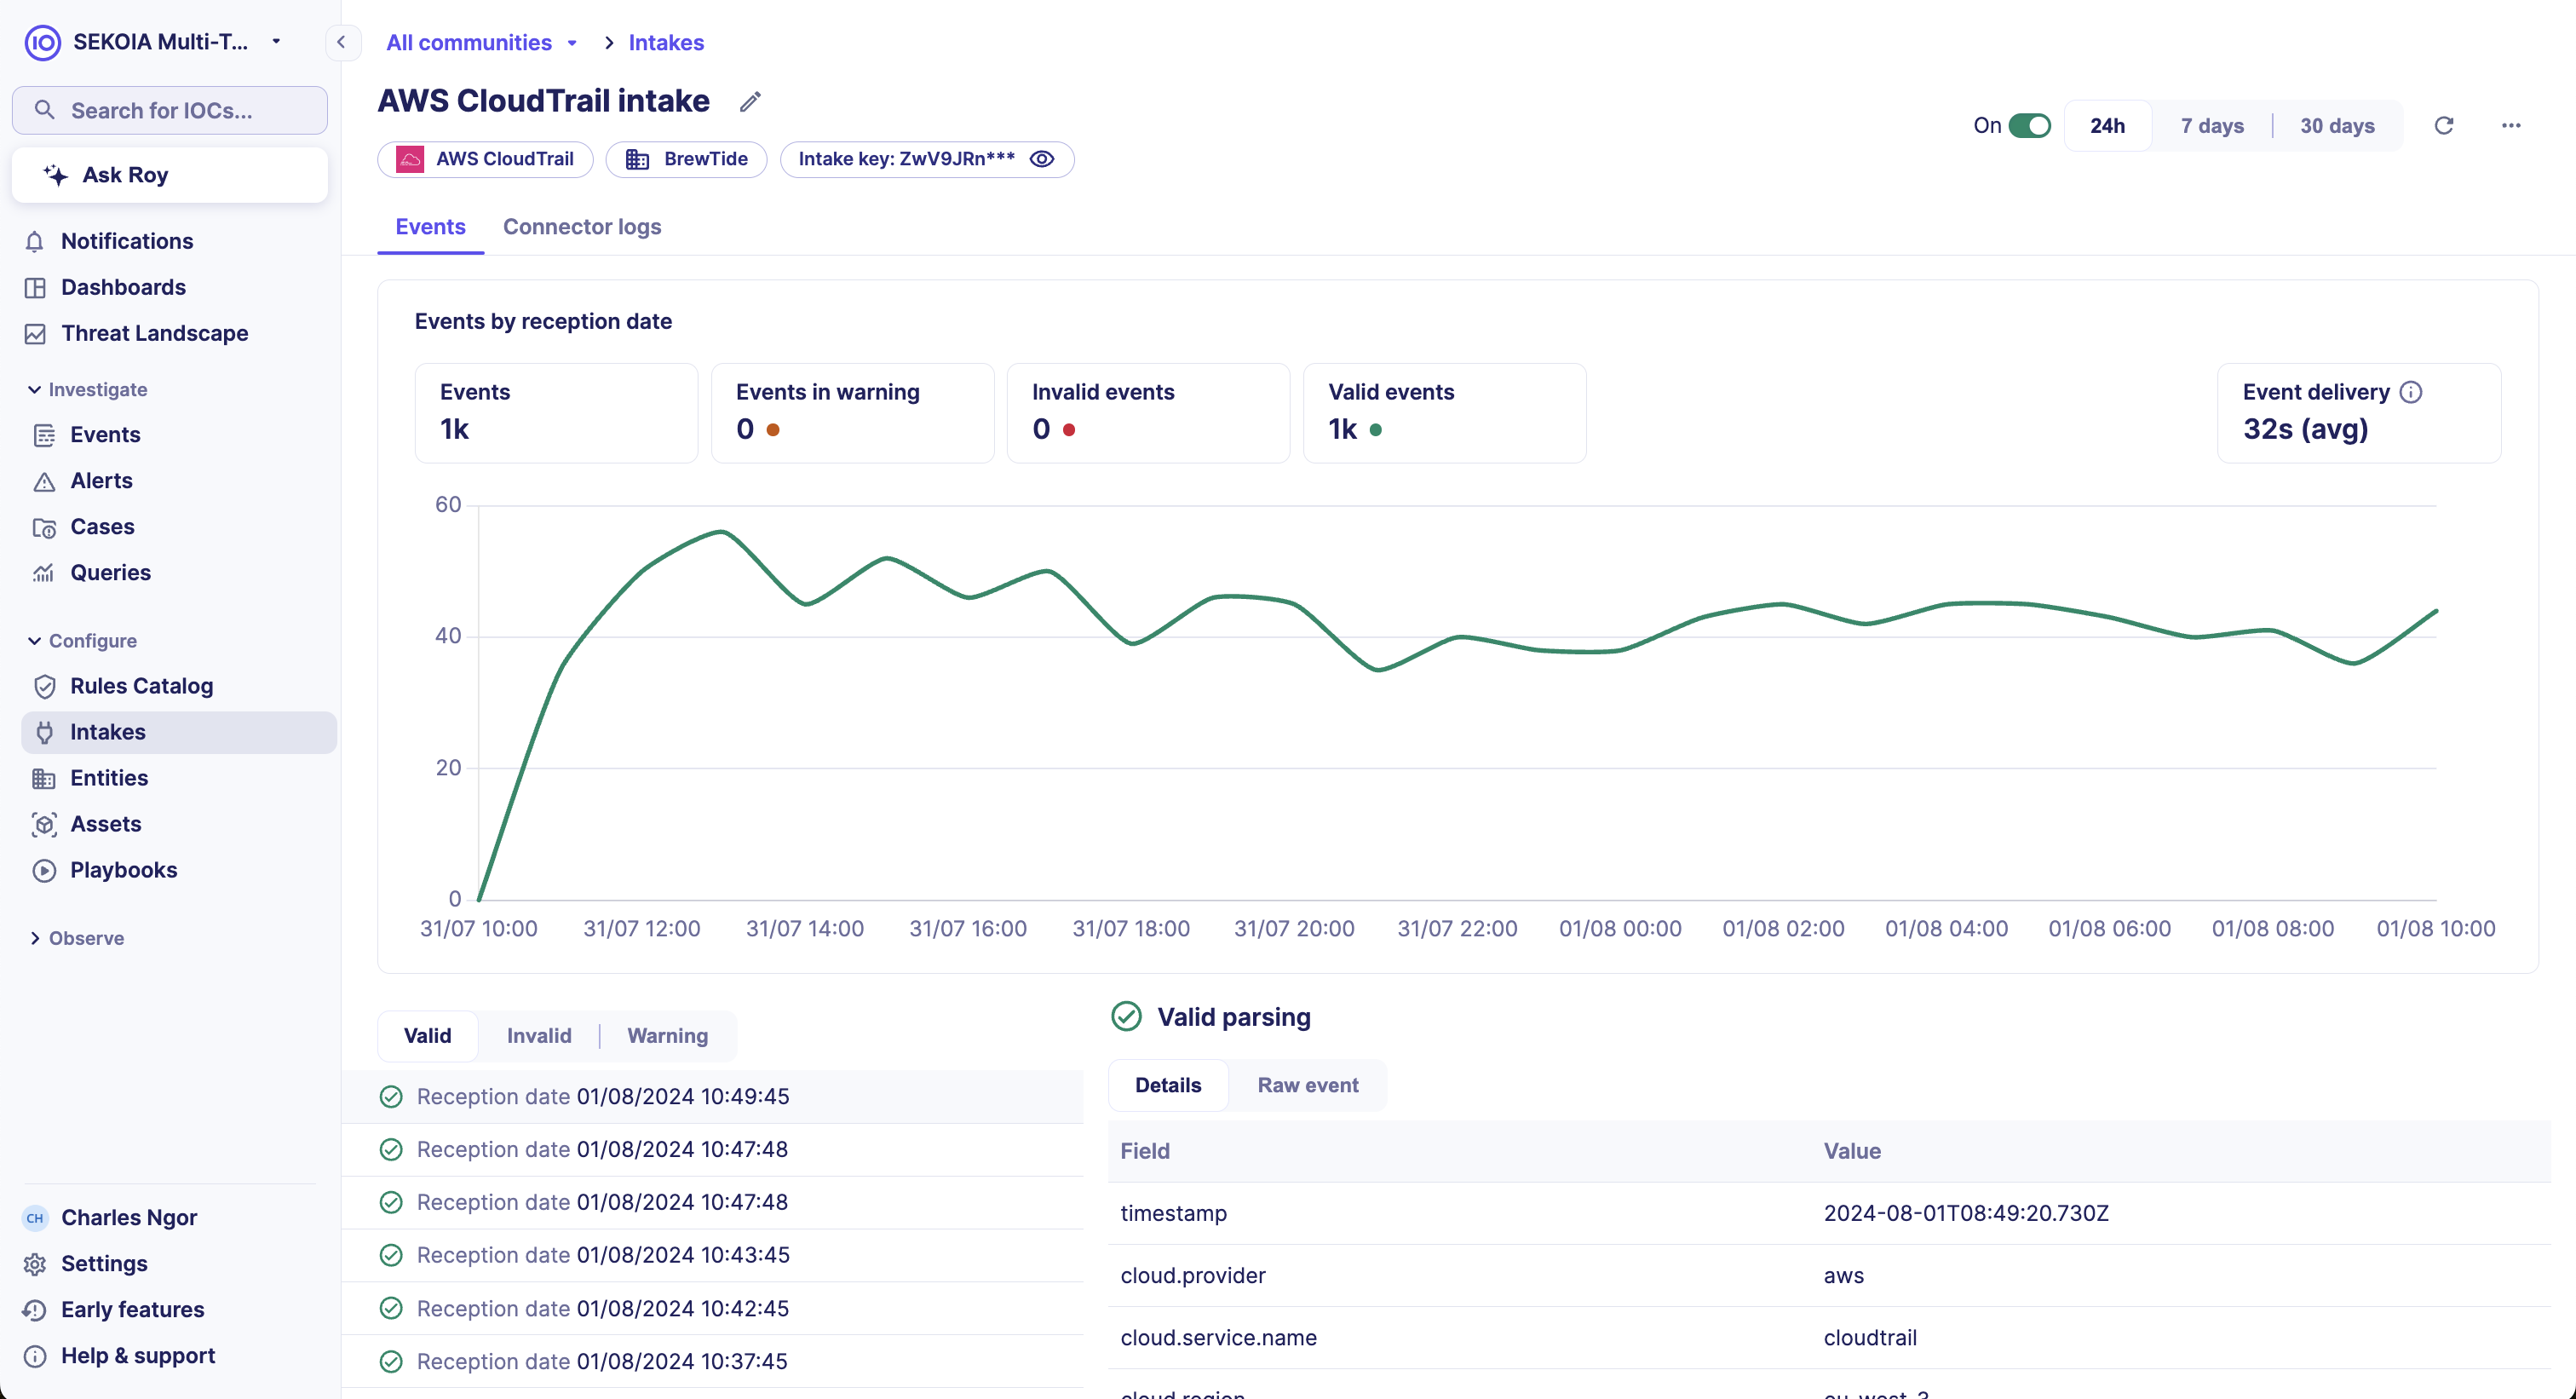
Events graph
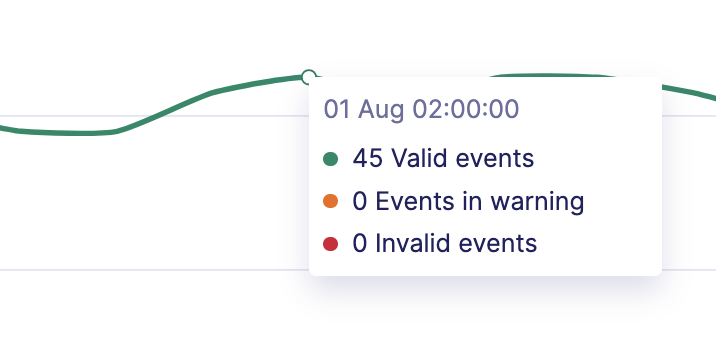
The events graph provide metrics on the ingestion of your logs. The metrics are calculated on the selected period (24h, 7 days or 30 days).
Warning
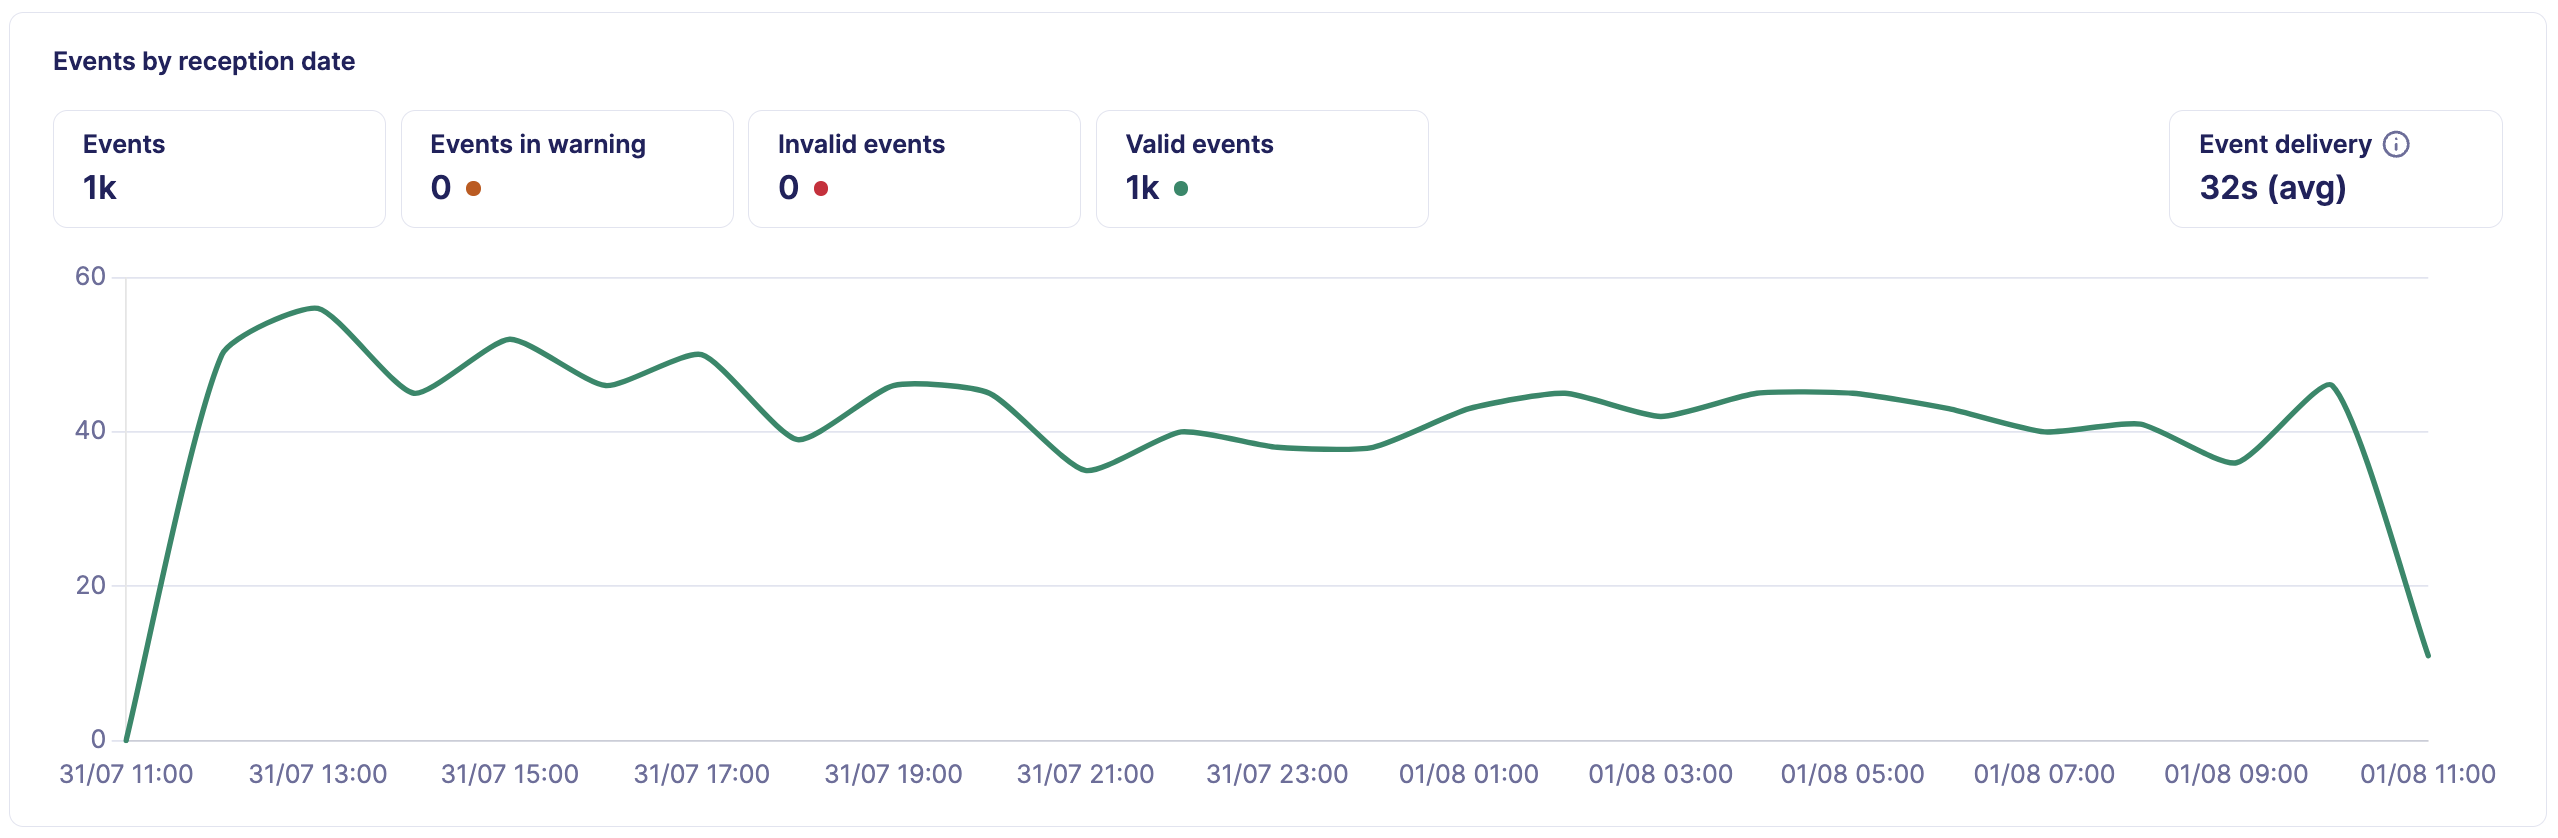
Events are displayed by their reception date in the graph. By using the reception date, you are guaranteed to see events received recently in graph and avoid issues with wrongly dated events or events with important lags.
- Events: total number of events ingested in the selected period
- Events in warning: number of events in warning
- Invalid events: number of invalid events
- Valid events: number of valid events
- Event delivery: represents the average latency between the creation date of the original event and the reception date of the event at Sekoia
Tip
Hover the mouse on the graph to view the number of events per time unit.
Event delivery
The event delivery metric is a lag indicator that computes an average value based on the elapse time between the moment the event is created in the data source and the moment it is received in Sekoia. Different factors can lead to an abnormal value:
| Potential issue | Description |
|---|---|
| Event wrongly dated | If events in the data source are wrongly dated, the event delivery indicator can have a high value or negative value |
| Data source timezone | A timezone issue can be at the origin of a high value or negative value |
| Data source unavailable | If the data source is unavailable for a long time, the lag value will increase because of the delay to collect events |
| Network/Bandwidth issues | Network and bandwidth issues will generate higher lag |
| Events burst | An unusual high burst of events can overload the ingestion and increase lag |
List of recent events
Below the events graph, you have access to the list of recents events. This list help you verify that you received your expected events and allow you to check the content and parsing of these events. Events are displayed by their reception date. Click on the Show more button to display additional events.
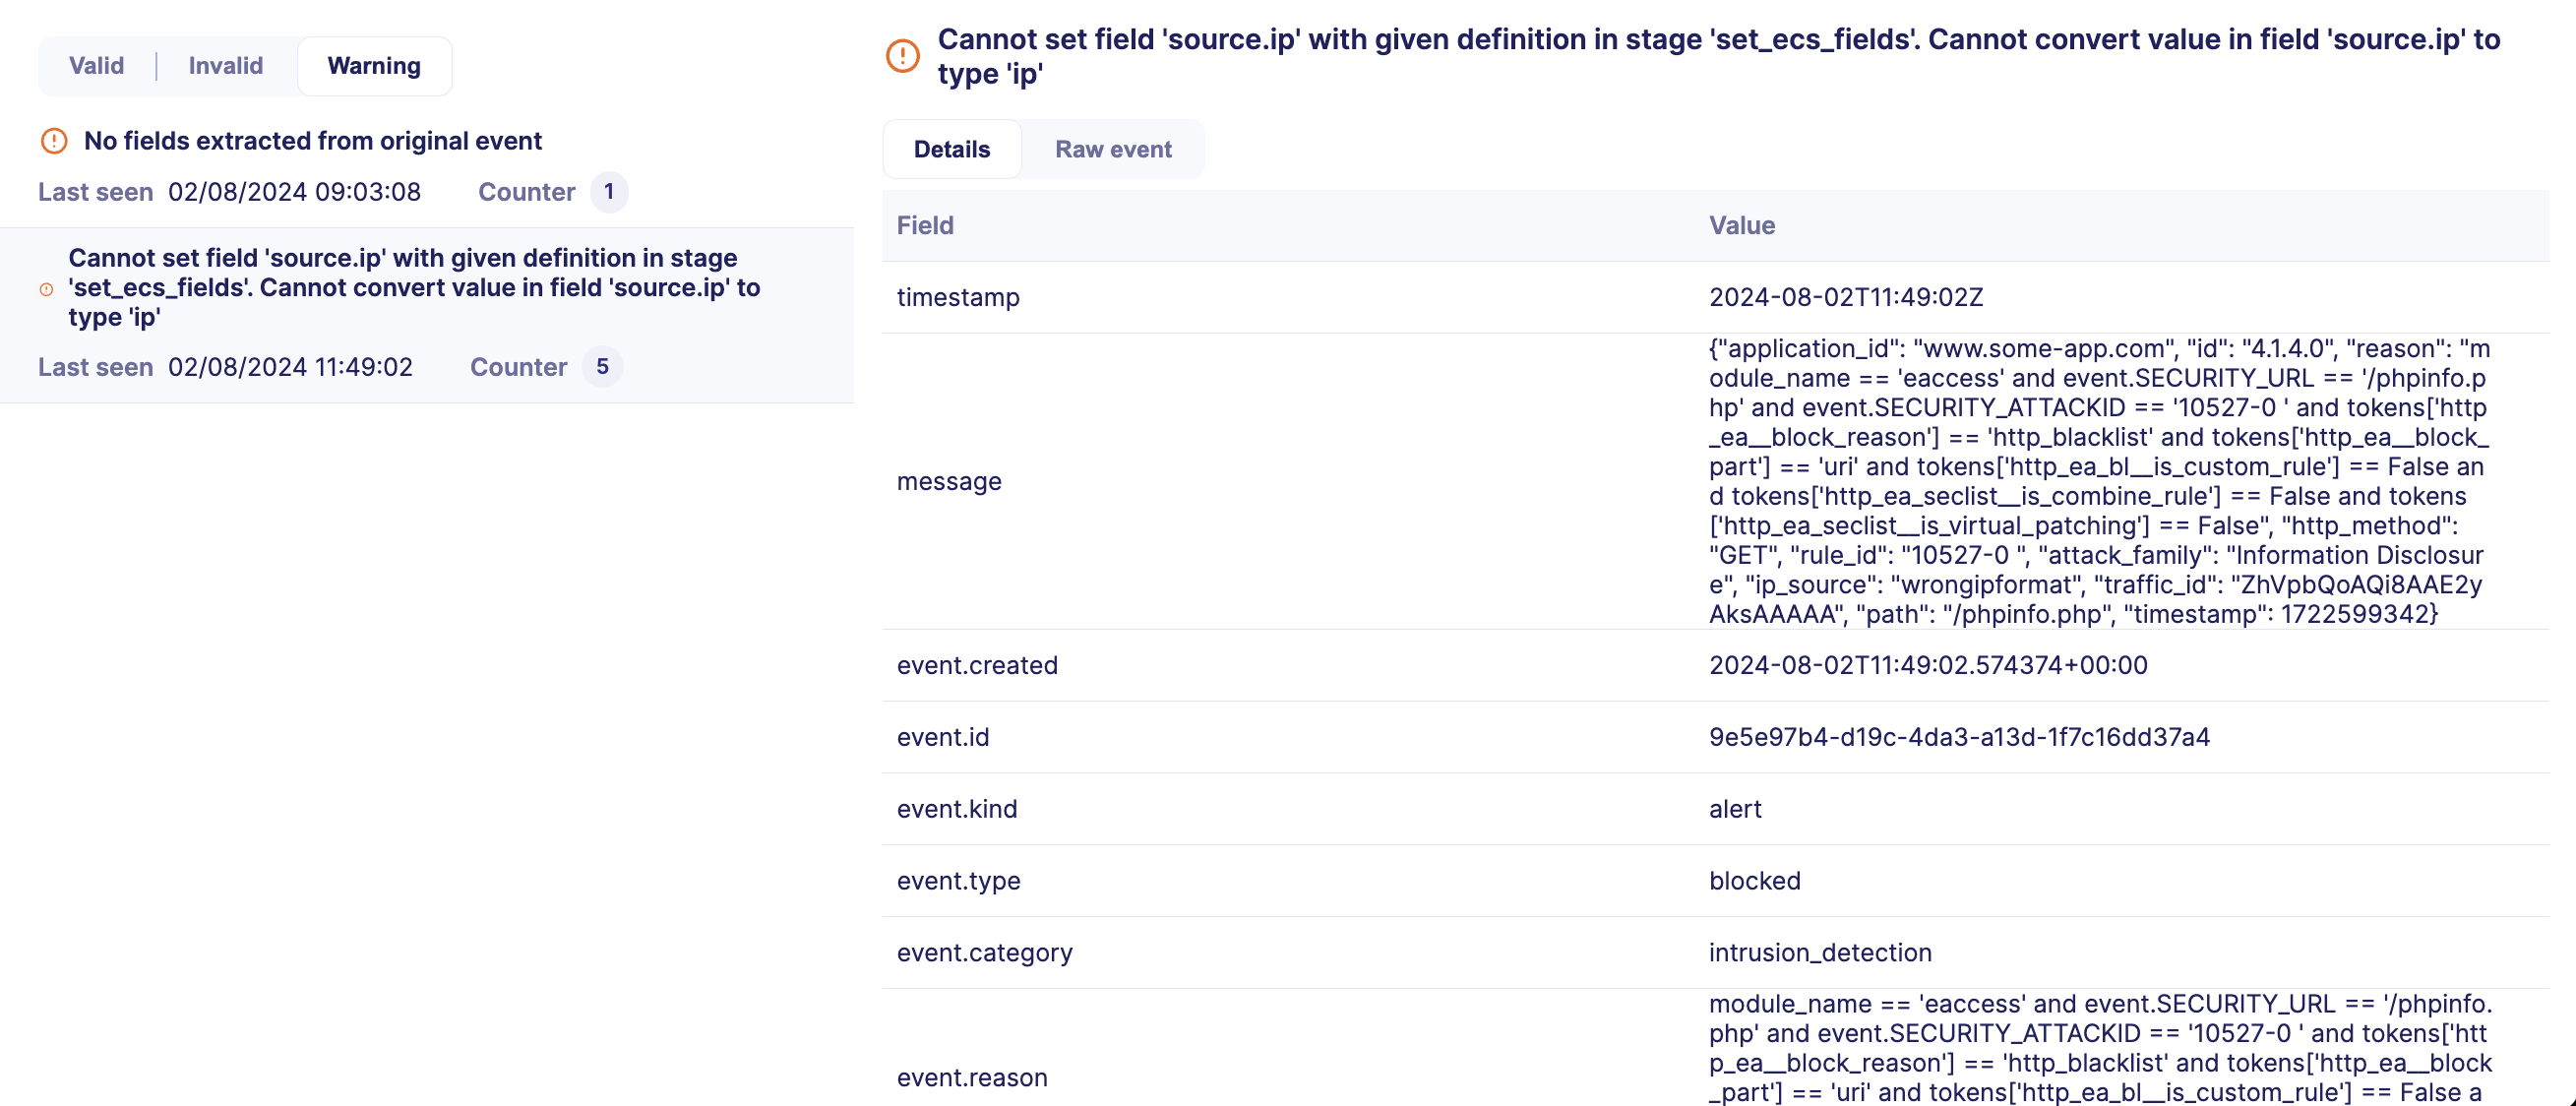
Invalid & Warning messages
Use the filter above the list of recent events to display the list of invalid or warning messages. This list contains the different type of parsing issues encountered. For each issue is displayed:
- The issue parsing message
- The last date when the issue was seen
- The number of occurrence of the issue
The last occurrence of the event can be consulted to troubleshoot issues.
Info
To preserve storage cost, only last occurrence of invalid event is stored in Sekoia.
Connector log
The Connector log tab is only available for Pull intakes.
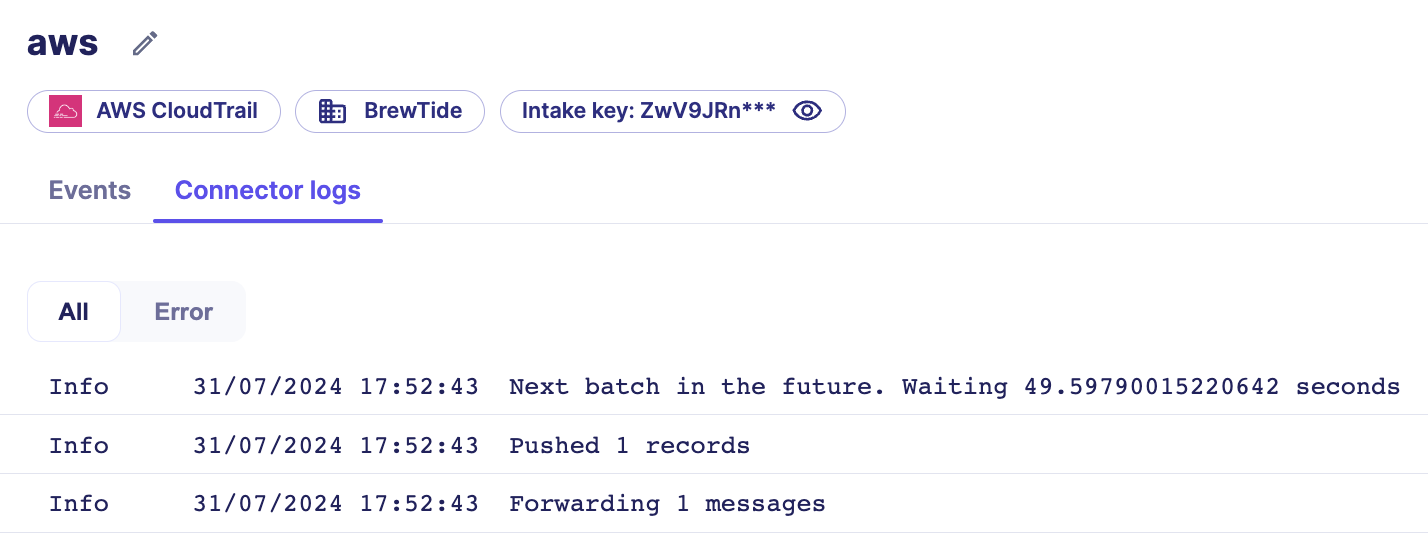
In this tab, you will find the latest logs of the connector. These logs help you check that the connector is functioning properly by checking the Info level messages.
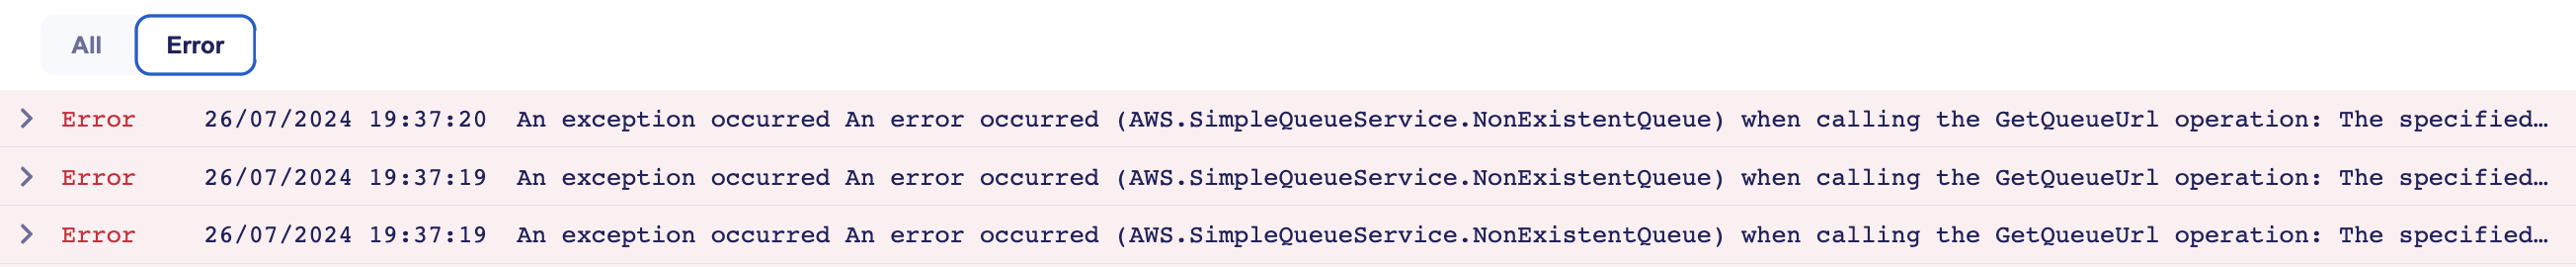
But they also help you troubleshoot issues by checking the Error level messages.
Use the filter button to filter Error logs.
If the error is related to a configuration issue, read the next section to modify the configuration of the connector.
Intake menu
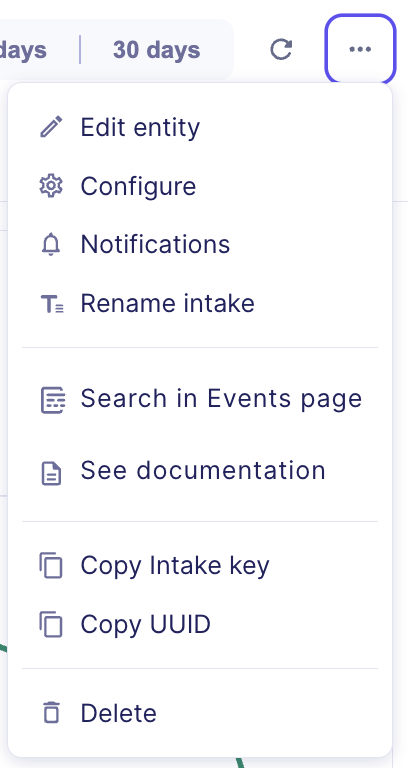
The intake menu allows you to perform different kind of actions:
- Edit intake entity
- Configure connector parameters (only for Pull intakes)
- Configure notifications on the intake
- Rename the intake
- Search events of the intake in the Events page
- Consult the documentation page of the intake
- Copy the intake key
- Copy the intake UUID
- Delete the intake
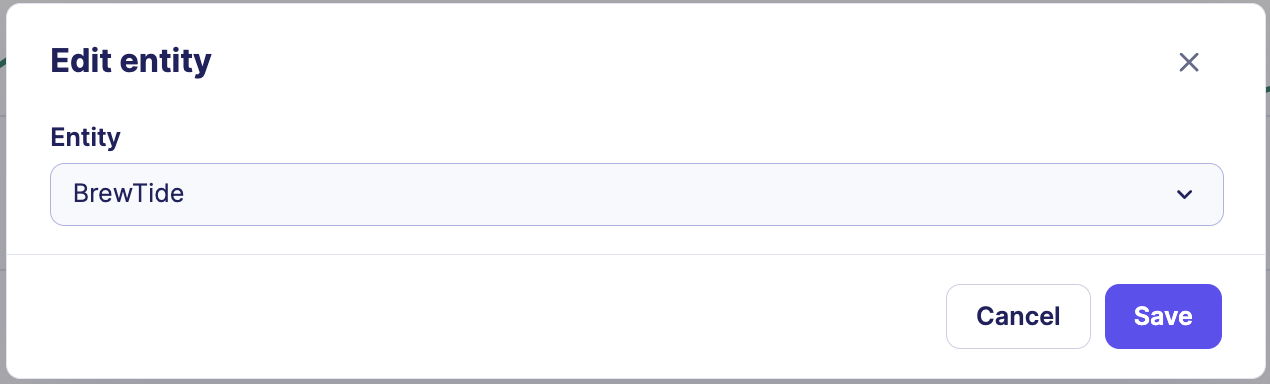
Edit entity
To modify the entity of the intake:
- Click on
Edit entityin the menu - Select a new entity in the list
- Save your modification
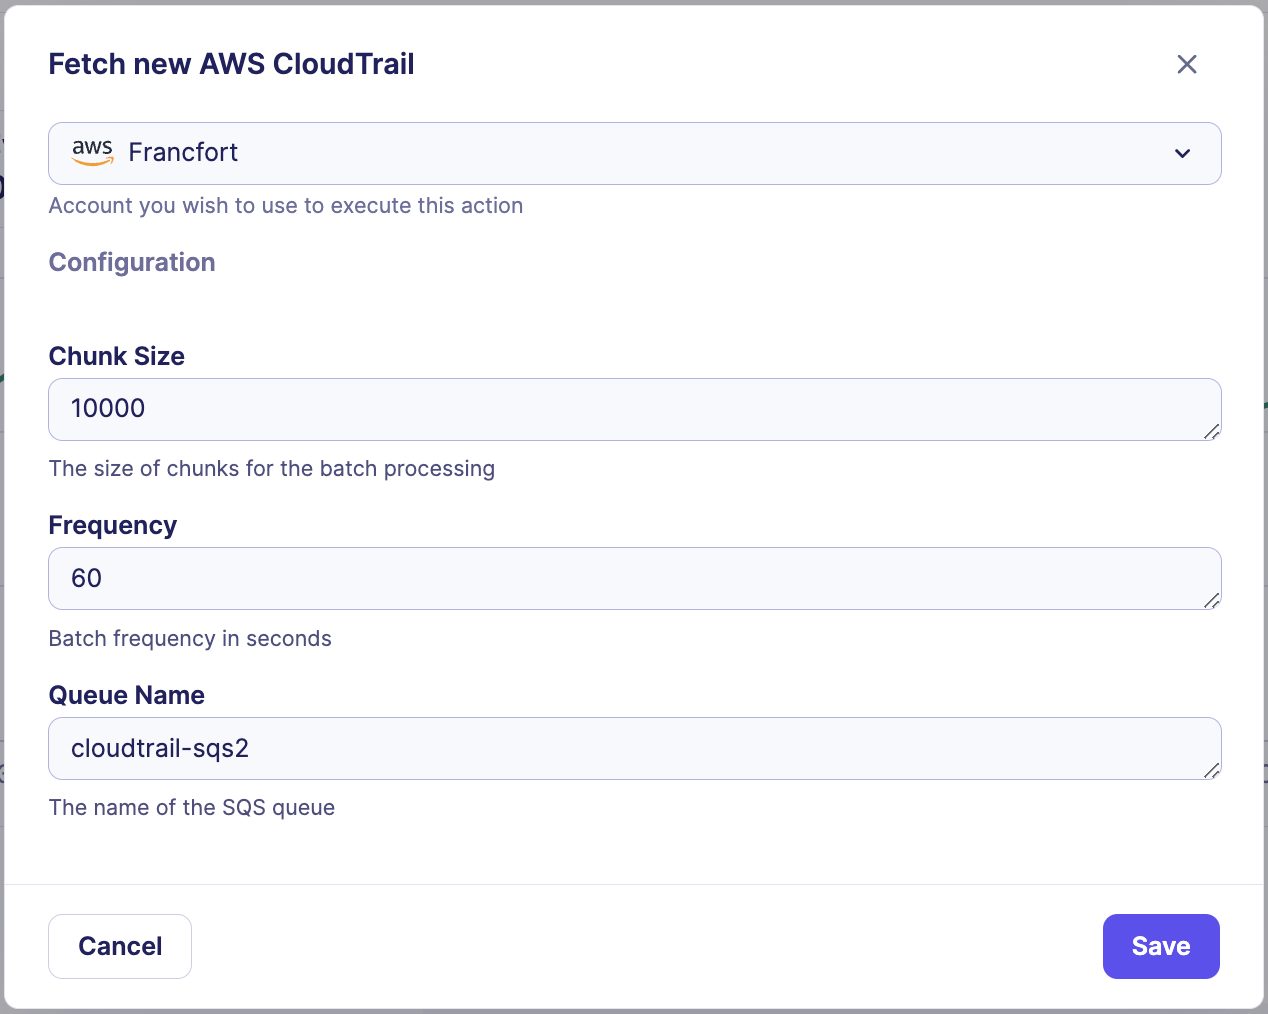
Configure pull intakes
This menu is only available for Pull intakes. Use this menu to modify the parameters of the connector. You can change the account used for authentication or change parameter values.
- Click on
Configurein the menu - Modify the configuration
- Save your modification
Info
The modifications are applied instantly. You do not need to restart the connector to take your modifications into account.
Notifications
To create a new notification on the intake:
- Click on
Notificationsin the menu - Configure the notification settings
- Save your modification
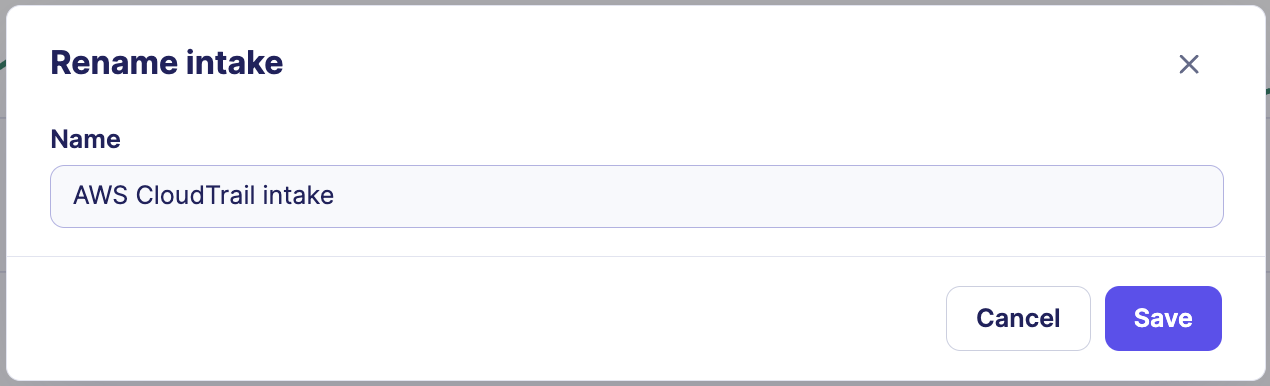
Rename intake
To rename the intake:
- Click on
Renamein the menu - Enter the new name of the intake
- Save your modification
Delete intake
To delete the intake:
- Click on
Deletein the menu - Confirm the deletion
Warning
The deletion of an intake do not remove the events already ingested. However, note that the intake key will no longer be usable. You will need to deploy a new intake key in your infrastructure if you wish to restore the same kind of intake.
Note
Do not hesitate to contact your support if:
- The settings’ recommendations provided are not sufficient or not applicable to your system. We can then see with you how to transfer your events in the best conditions.
- The format of the logs you want to send us is not in the list. We regularly add new formats and we can let you know when yours is available in our catalog.